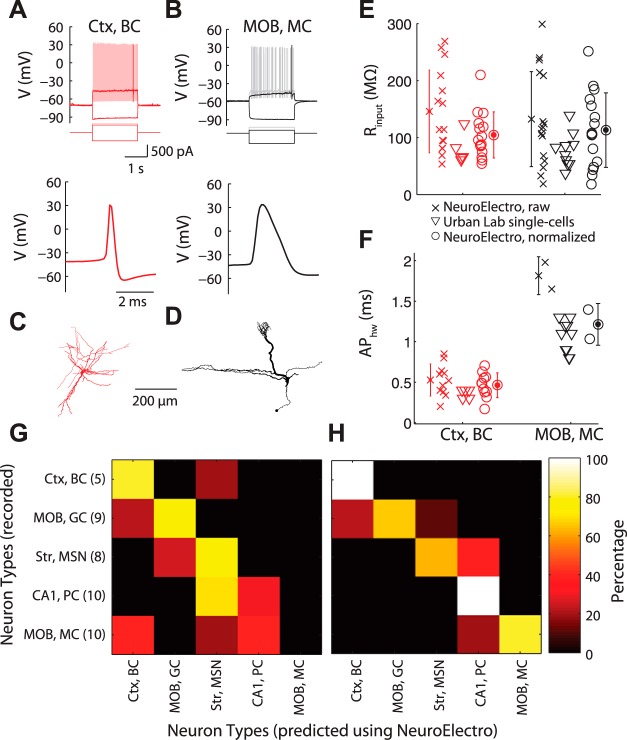
Fig. 3.
Direct comparison of NeuroElectro measurements to de novo recordings. A and B: representative recordings of a neocortical basket cell (Ctx, BC; A) and a main olfactory bulb mitral cell (MOB, MC; B), showing responses to hyperpolarizing, rheobase, and suprathreshold current injections (top), and action potential waveform (bottom). C and D: morphologies for cells in A and B. E and F: database measurements for mitral and basket cells before (crosses) and after (circles) metadata normalization and corresponding Urban Lab single cell measurements (triangles). Error bars indicate SD, computed across database measurements within a neuron type. G and H: confusion matrices highlighting classification of each recorded single cell to corresponding aggregate NeuroElectro neuron type for the raw (G) or metadata-normalized (H) NeuroElectro dataset. Matrix y-axis indicates recorded neuron identity and number within parentheses indicates n of recorded single cells per neuron type. The x-axis indicates the predicted neuron type based on biophysical similarity to NeuroElectro (i.e., perfect classification is a diagonal along matrix). MOB, GC, main olfactory bulb granule cell.

