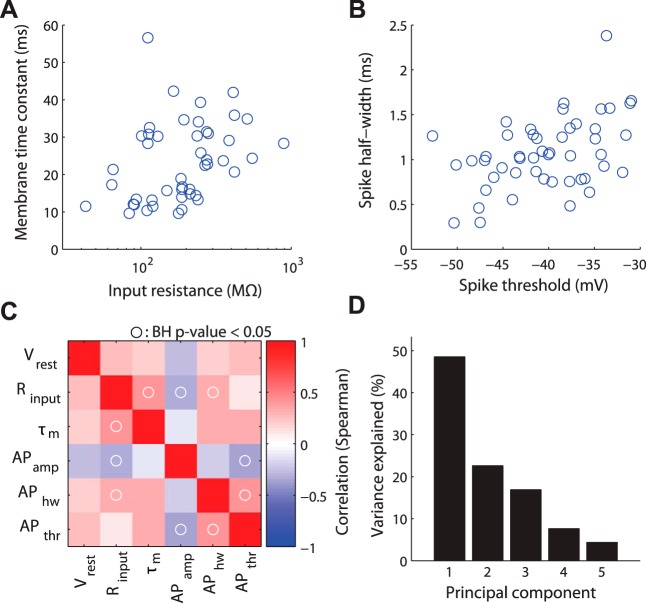
Fig. 4.
Exploring correlations between biophysical properties. A and B: example data showing pairwise correlations among biophysical properties. Each data point corresponds to measurements from a single neuron type (after averaging observations collected across multiple studies and adjusting for experimental condition differences). C: correlation matrix of biophysical properties (Spearman's correlation). Circles indicate where correlation of biophysical properties was statistically significant (P < 0.05 after Benjamini-Hochberg false discovery rate correction). D: variance explained across probabilistic principal components of electrophysiological correlation matrix in C.

