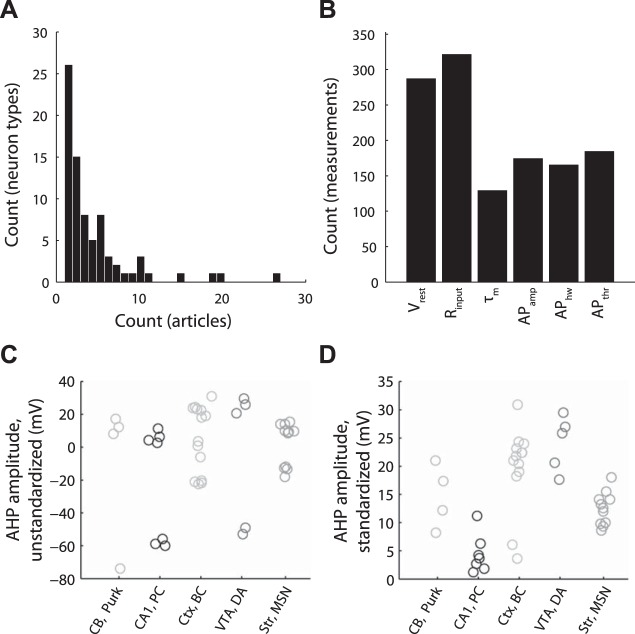
Fig. A1.
Distribution of neuron types and electrophysiological properties represented in NeuroElectro and illustration of electrophysiological property standardization. A: frequency histogram of distribution of neuron types vs. number of articles containing information about each neuron type. B: count of unique measurements of the 6 electrophysiological properties explored in this article. C and D: illustration of manual electrophysiological property standardization for NeuroElectro measurements extracted from literature. Example afterhyperpolarization (AHP) amplitude measurements before (C) and after standardization (D) to a common calculation definition. Neurons plotted are cerebellar Purkinje cells, CA1 pyramidal cells, cortical basket cells, ventral tegmental area dopaminergic cells, and striatal medium spiny neurons (abbreviated as Purk; CA1, pyr; Ctx, bskt; VTA, DA; and Str, MSN; respectively). Each circle denotes the value of the mean electrophysiological measurement reported within an article.

