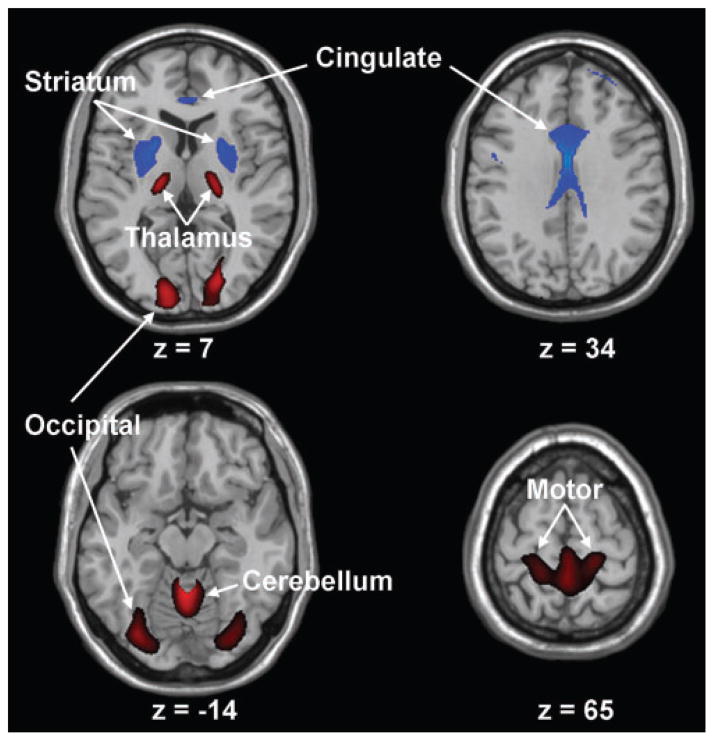
Fig. 1.
Huntington’s disease-related pattern. This spatial covariance pattern was identified by network analysis of baseline FDG PET scans from 12 p-HD gene carriers and 12 age-matched healthy volunteer subjects. This pattern, representing the PC1 in the combined group analysis, accounted for 18% of the subject × voxel variation. Subject scores for this HD-related pattern (HDRP), representing network expression in individual subjects, discriminated the p-HD subjects from the controls (P<0.01). The HDRP is characterized by relative metabolic decreases in the striatum and cingulate cortex, associated with relative increases in the ventral thalamus, motor cortex (BA 4) and occipital lobe (BA17, 18). [The display represents voxels that contribute significantly to the network at P =0.005 and that were demonstrated to be reliable by bootstrap resampling procedures [inverse coefficient of variation (ICV)>3.5; P<0.001].Voxels with positive region weights (metabolic increases) are colour coded from red to yellow; those with negative region weights (metabolic decreases) are colour coded from blue to purple. The numbers under each slice are in millimeters, relative to the anterior-posterior commissure line.]

