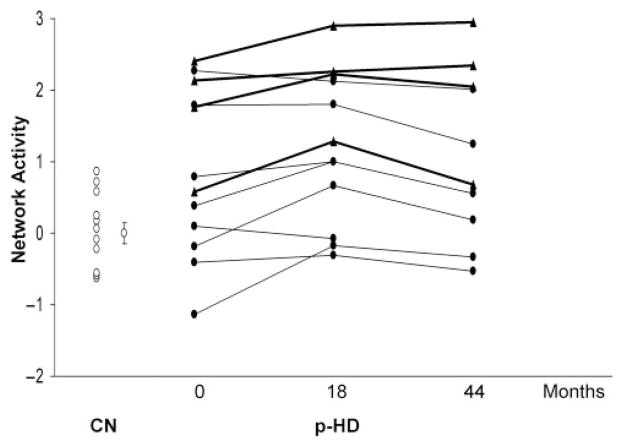
Fig. 2.
Changes in HDRP expression. Individual subject HDRP expression for the 12 p-HD subjects scanned at baseline, and following 18 and 44 months. Network activity is represented separately for the four p-HD subjects (filled triangles) who subsequently developed symptoms (bold lines), and for the eight remaining p-HD subjects (filled circles) who had not phenoconverted by the third time point (fine lines, see text). Values for 12 age-matched healthy control subjects (CN, open circles) are presented for reference. [Bar represents the SE of the control values.]

