
Figure 4. Dopaminergic neurons from R1441C LRRK2 transgenic mice exhibit increased neurite complexity.
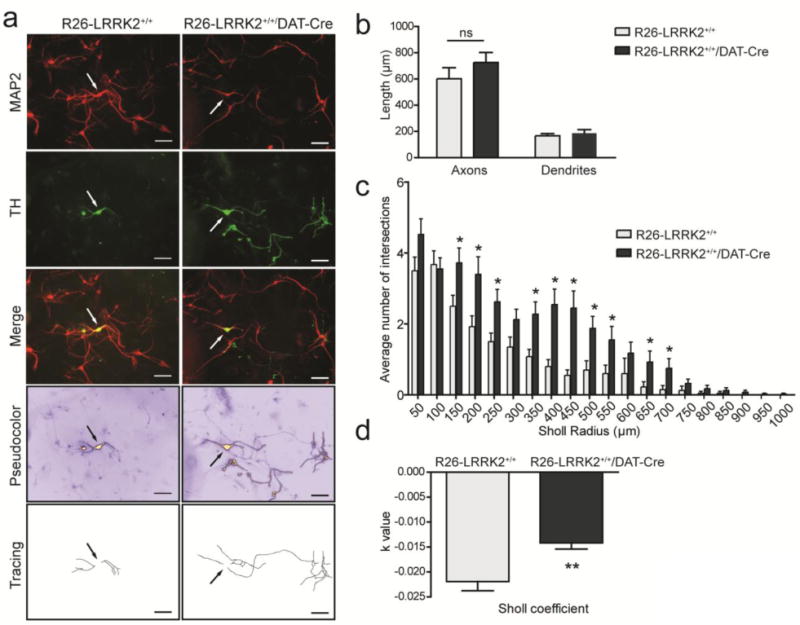
(A) Primary cultures prepared from the ventral midbrain of R26-LRRK2+/+/DAT-Cre and R26-LRRK2+/+ littermate controls at P1, fixed on DIV 7, and immunostained with antibodies against MAP2 and TH to label dopaminergic neurons. Representative fluorescent microscopic images are shown for each condition. ICA pseudocolor was employed to identify the dopaminergic neuronal soma (arrows) and neuritic processes for tracing. Scale bar: 500μm. (B) Quantitation of axonal and dendritic process length of TH-positive dopaminergic neurons in independent midbrain cultures derived from at least four mice per genotype. Bars represent neurite length (mean ± SEM, n = 80 neurons/genotype). (C) Sholl analysis of TH-positive dopaminergic neurites at DIV 7 to assess the mean number of dendritic intersections with concentric circles of increasing radii (μm) centered in the soma of each neuron. Bars represent mean ± SEM (n = 80 neurons/genotype). (D) Sholl regression coefficient (k value) is used to describe the changes in dendritic arborization with increasing distance from the neuronal soma. The value arises from the function: log10 (N/S) = -k × r + m, where N is the number of dendrite intersections for a circle of area S and radius r. The slope, k, of the regression line that results from this equation is decreasing with greater changes in the density of dendrites as the distance from the soma increases. Measurements were performed on independent cultures derived from at least four mice for each genotype. Data represent the mean ± SEM (n = 80 neurons/genotype). Comparisons between the two genotypes were done by unpaired, two-tailed Student's t-test (*P<0.01 or **P<0.0001). ns, non-significant.