
Figure 6. Abnormal nuclear morphology in aged R1441C LRRK2 transgenic mice.
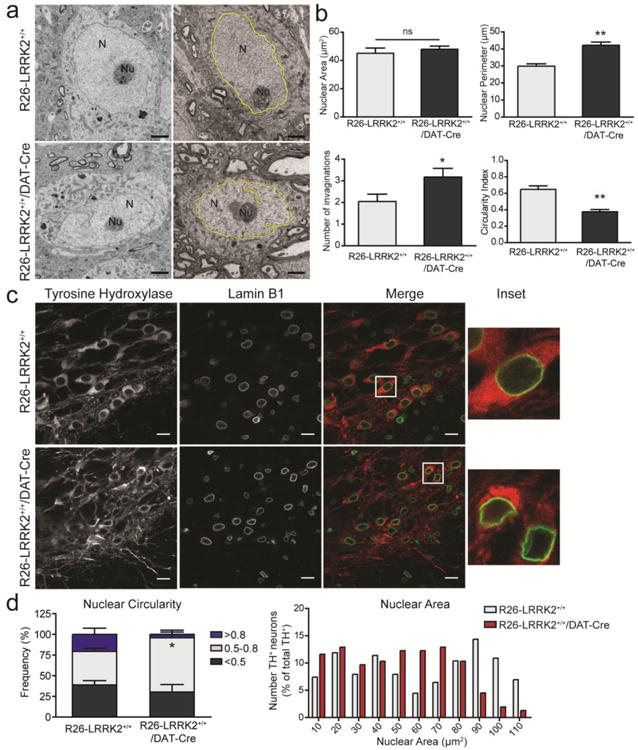
(A) Transmission electron microscopic analysis of ventral midbrain tissue from 20-22 month-old R26-LRRK2+/+/DAT-Cre and R26-LRRK2+/+ mice. The nucleus (N) and nucleolus (Nu) are indicated in representative images of neurons for each mouse genotype. Examples of nuclear traces used for quantification are highlighted in yellow. Scale bar: 2μm. (B) Quantitation of the nuclear area (μm2), nuclear perimeter (μm), average number of invaginations per nuclei and circularity index. Data represent the mean ± SEM (n ≥ 10 neurons/animal) sampled from at least 2 animals/genotype. (C) Immunofluorescence analysis of the substantia nigra from transgenic mice at 22 months co-labeled with antibodies to TH and Lamin B1 to determine nuclear morphology in dopaminergic neurons. Insets represent enlargement of the boxed areas in merge images. Scale bar: 15 μm. (D) The morphology of the nuclear envelop was assessed using a circularity index ranging from 0 (irregular shape) to 1 (perfect circle). The frequency distribution of nuclear circularity (left) and area (right) from dopaminergic neurons are shown in each graph. Data represent the mean ± SEM (n = 220, R26-LRRK2+/+, or n = 158, R26-LRRK2+/+/DAT-Cre, neurons) sampled from 4 mice/genotype. Statistical analysis was performed by unpaired, two-tailed Student's t-test (*P<0.05 or **P<0.001). ns, non-significant.