Fig. 1.
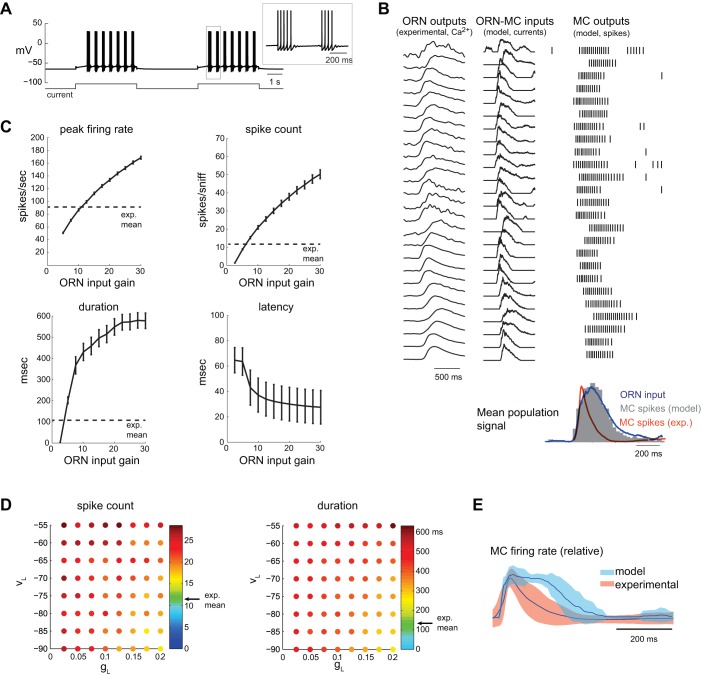
Response of model mitral/tufted cells (MC) to naturalistic sensory inputs. A: response of model MC to current step. MC responds with clusters of spikes, as seen in the simulated membrane voltage (Vm). Between spike clusters, the model exhibits subthreshold oscillations, which are visible in the inset. B: model MC responses to the experimentally obtained olfactory receptor neuron (ORN) input set {ORN-MC gain (G[ORN-MC]) = 7.5}. Left: raw presynaptic calcium signals (gray) for the 25 different glomeruli used for the input dataset (see materials and methods). Center: ORN-MC synaptic input current waveforms for each MC. Right: spike rasters of MC firing responses to each of the sniff-driven inputs. Input currents are reversed in polarity to facilitate comparison to ORN calcium signals. Bottom: histogram of model MC spiking output (time bin = 20 ms, averaged across all inputs, dark gray), showing a close match to the ORN input population firing rate envelope (averaged across all inputs, blue). Orange trace shows average MC response firing rates from the experimental dataset, which consists of much shorter sniff-triggered bursts. Histogram and traces are scaled to the same peak value. C: effects of varying ORN input gain (G[ORN-MC]) on different parameters of the sniff-driven model MC spike burst. Values for leak parameters were fixed in these examples at gL (leak conductance) = 0.1 and VL (leak reversal potential) = −65 mV. The peak firing rate, evoked spike count per sniff, and response duration all increase with ORN input gain, while latency decreases. Error bars show means ± SE of the MC response averaged across the population of 25 ORN inputs shown in B. D: effects of varying MC leak parameters on sniff-driven response dynamics. Each grid shows gL vs. VL. For each (gL, VL) point, ORN input gain is varied to achieve a mean MC peak firing rate (averaged across all 25 ORN inputs) matching that of the experimental dataset (92 spikes/s). Pseudocolor values at each point indicate the spike count (left) or burst duration (right) for that excitability value. Arrow (“exp. mean”, green pseudocolor) indicates the mean value of the experimental MC dataset. Both spike count and duration remain larger than the experimental mean values at all tested gL and VL values. E: dynamics of experimental and model MC firing rate responses relative to time of inhalation, averaged across all recorded (orange) or model (blue) units. gL = 0.1, VL = −65 mV, G[ORN-MC] = 7.5. Before averaging, instantaneous firing rate was calculated from each interspike interval, and a continuous trace interpolated between spike times. Shading indicates variance (SD) around mean. The model MC population responds with a longer duration and broader peak firing profile. The experimental dataset represents the sniff-triggered response to the same sniff waveform recorded from 37 MCs (Carey and Wachowiak 2011).

