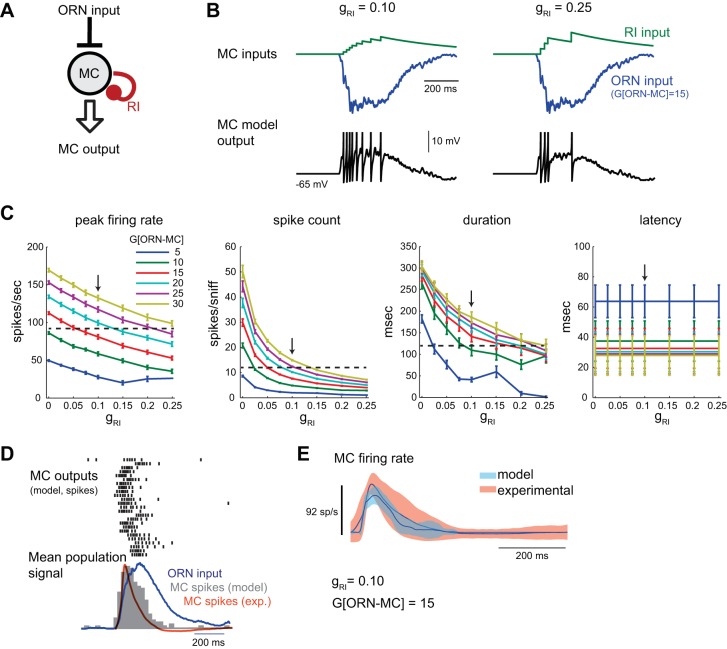
Fig. 2.
Effect of recurrent inhibition (RI) on model MC output. A: schematic of ORN-MCRI model with RI simulating inhibitory feedback from periglomerular (PG) or granule cell (GC) neurons onto the MC after each MC spike. See text for details. B: input currents (RI, green; ORN, blue) to the model MC and MC Vm in response to one inhalation of odorant. As the strength of RI [RI conductance (gRI)] is increased, MC spiking is reduced. Spikes are clipped. C: summary of effects of RI strength (gRI) on response dynamics to sniff-driven ORN inputs at several ORN input gains (range tested: 0–30), averaged across all ORN inputs as in Fig 1 (mean ± SE). Increasing RI reduces peak MC firing rates, spike counts, and response durations, but has little effect on latencies. Horizontal dashed line indicates mean experimental value, as in Fig. 1; arrow indicates optimal value for RI strength (gRI = 0.10) for best match across peak firing rate, spike count and duration for the model MC population. Latency values are also shown. D: response of ORN-MCRI model to the 25 different sniff-driven ORN input waveforms. Spike rasters (top) and histogram (gray, bottom) of the model MC population show reduced firing rates compared with the ORN-MC model and moderate temporal sharpening relative to the dynamics of the ORN input, but the model MC population response remains longer than that of the experimental dataset (orange trace). gRI = 0.10, G[ORN-MC] = 15. E: mean and variance of experimental and model MC firing rate responses relative to time of inhalation, averaged across all recorded (orange) or model (blue) units as described above.

