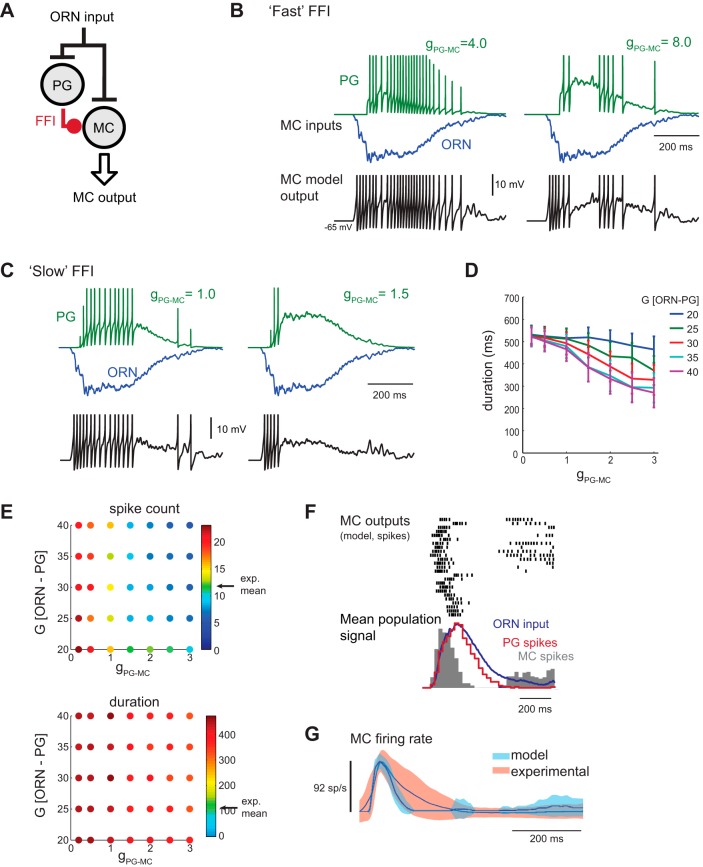
Fig. 3.
Effect of feedforward inhibition (FFI) on model MC output. A: schematic of glomerular circuit incorporating FFI. ORN input is injected simultaneously to the MC model and a single-compartment PG cell model. The PG cell provides inhibitory synaptic input to the MC. See text for details. B: example response of a model PG and MC to inhalation of odorant using the “fast” FFI synapse at two different FFI strengths (gPG-MC = 4.0 and 8.0). Top traces show synaptic input currents to the model MC from the PG cell (PG, green trace) and from a sample ORN population (ORN, blue). Bottom trace shows model MC Vm. At low FFI strengths (left), MC spiking remains prolonged and roughly follows ORN input dynamics. At higher FFI strengths (right), MC spiking does not occur in a single burst and thus does not permit inhalation-linked spike patterning. ORN input gain (G[ORN-PG] and G[ORN-MC]) = 18. Spike-evoked synaptic input transients are clipped. C: input currents (FFI, green; ORN, blue) to the model MC and MC Vm in response to inhalation of odorant using the “slow” FFI synapse model at two different FFI strengths. The slower FFI current lags the ORN input current and accumulates over the course of the sniff, allowing the inhalation-linked MC spike burst to develop but shortening burst duration. ORN input gain values are different for PG and MC inputs: G[ORN-PG] = 35; G[ORN-MC] = 18. D: increasing the strength of slow FFI (gPG-MC) reduces the duration of the model MC spike burst. Plots show mean ± SE of the burst duration averaged across all 25 ORN input traces for different gains of ORN input to the PG cell (G[ORN-PG]). ORN input gain to the MC was held fixed (at 18). Due to its slow onset, response latency is unaffected by FFI (not shown). E: effects of varying FFI conductance (gPG-MC) and input gain to the PG cell (G[ORN-PG]) on spike count (top) and duration (bottom) of the sniff-driven MC spike burst. ORN input gain to the MC (G[ORN-MC]) is calibrated at each tested point to generate a peak firing rate of ∼92 spikes/s. With the ORN-PG-MC model, spike counts matching the experimental dataset (arrow, “exp. mean”) can be achieved within a limited range of FFI strengths and ORN-PG input gains (indicated by green dots). Response durations remain longer than experimentally recorded values at all parameter combinations, primarily as a result of firing bursts late in the sniff phase. F: response of the ORN-PG-MC model to the 25 ORN input waveforms, showing spike rasters and population histogram (gray) for each model MC response as in Fig. 2D. The population spike histogram of each PG cell response is also shown (red trace). FFI conductance (gPG-MC = 1.5) and gain (G[ORN-PG] = 35; G[ORN-MC] = 18) parameters were chosen to produce 92 spike/s peak MC firing rate. PG cell spiking roughly follows ORN input dynamics, while the MC spike burst is shortened and reaches a peak earlier relative to ORN inputs. Note the emergence of late-phase spiking in some MC units with this circuit. G: population mean and variance of experimental and model MC firing rate responses relative to time of inhalation for the ORN-PG-MC model. In contrast to the ORN-MC models in Figs. 1 and 2, the ORN-PG-MC population shows slightly shorter bursts than the experimental dataset.

