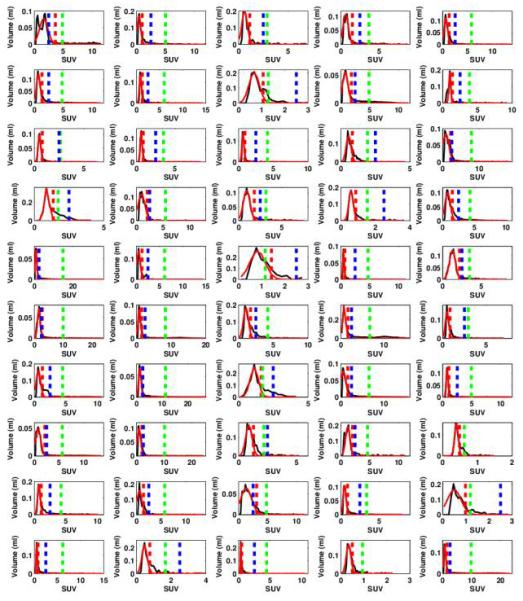
Fig. 6.

Overview for the 50 tumor VOIs drawn around the selected lung lesions, with the corresponding Histogram for each VOI with the Gaussian fit around the mode (red line) determining the BSL cut off (red dotted line). The cut off lines for TLG42% (green dotted line) and TLG2.5 (blue dotted line) are given as well.
