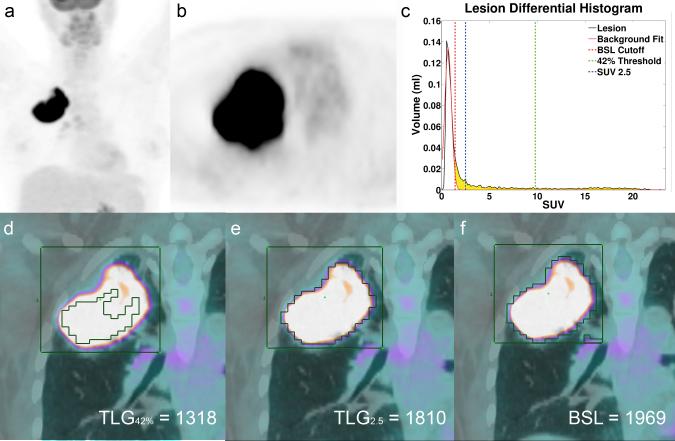
Fig. 7.
a MIP FDG PET image of patient 49 with a large lung tumor in the right upper lobe with SUVmax 23.3. b Axial slice of the tumor in the right upper lobe. c Histogram of the VOI illustrated in d-f, with the threshold lines for TLG42% (green), TLG2.5 (blue) and the cut off for BSL (red). BSL is represented by the sum of all yellow voxels in the histogram. d All voxels with a SUV above 42% of SUVmax representing TLG42% (1318 ml*SUV), illustrating a clear underestimation of the total tumor burden. e Represents the volume of all voxels with an SUV above 2.5, representing TLG2.5 (1810 ml*SUV) since this lesion had a TLG2.5 > 50 ml*SUV 1810 ml*SUV served as the surrogate reference standard. f Includes all voxels above background (BSL 1969 ml*SUV), overestimating TLG2.5 only by 8%.

