
Figure 1.
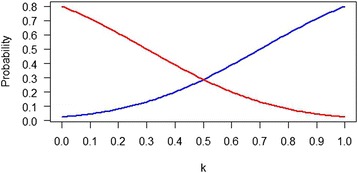
Plot of Pr(LCL > kδ | H 1) (red curve) and Pr(UCL < kδ | H 0) (blue curve) for k ∈ [0,1], α = 0.05, β = 0.80 in a comparison of normally distributed mean responses with known σ between treatment and control groups for a 1:1 randomized clinical trial.