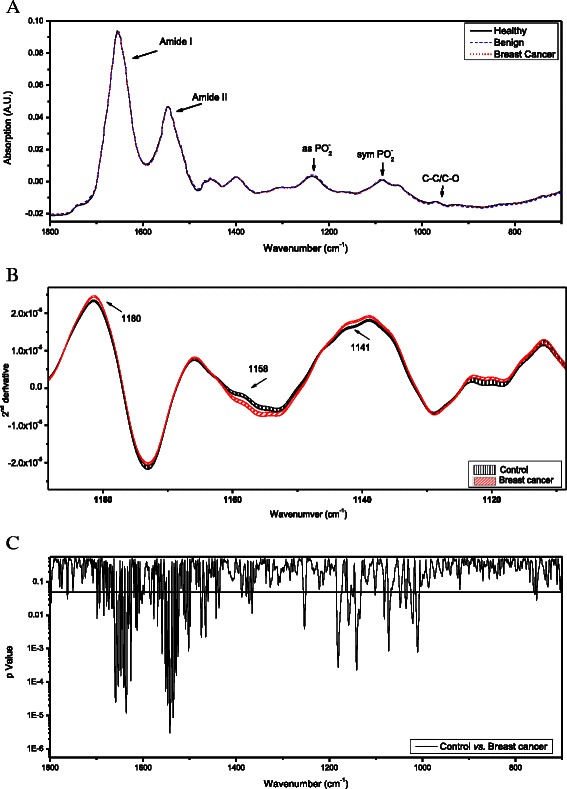
Fig. 1.

FTIR-MSP spectra of PBMCs of cancer patients and healthy controls. (a) Average of the absorption spectra of PBMC of each study group between 1800 cm−1 and 700 cm−1. The spectra are vector normalized. Each spectrum of a single subject is an average of five measurements at different locations of the PBMCs dried film. The absorbance bands of the major functional bonds of the bio-molecules are marked. (b) Second derivative expanded spectra of PBMCs from each subjects’ group are presented. The mean ± SEM for each of the data sets is represented by the thickness of the graph lines. (c) t-test analysis of the second derivative spectra of control group vs. cancer patients group. The t-test is represented by p-Value (in log scale) for each wavenumber along the IR spectra. Statistically significant differences are present at various wave-numbers which are indicated by p-values below 0.05 represented by the black horizontal solid line
