
Fig. 4.
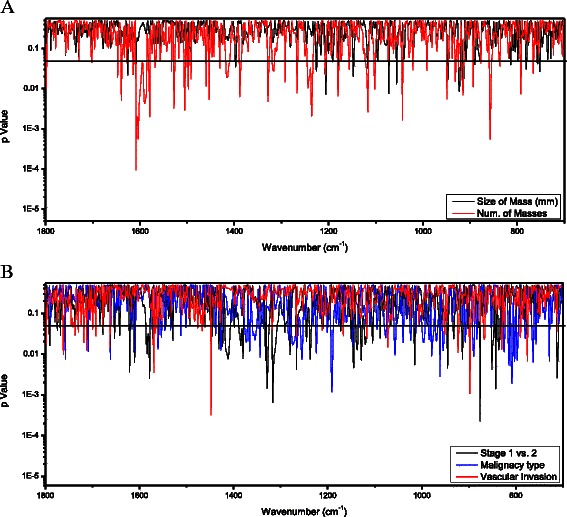
T-test analysis of the FTIR-MSP second derivative spectra of plasma of cancer patients group. The t-test is represented by p-Value (in log scale) for each wavenumber along the IR spectra. Comparison between the following pathological parameters: (a) Size of mass bellow 20 mm vs. above 20 mm; Single mass vs. multiple masses (b) Cancer stage 1 vs. stage 2; malignancy type - Ductal vs. Lobular Carcinoma; positive vs. negative for vascular invasion. Statistically significant differences are found at various wave-numbers indicated by p-values below 0.05 displayed by the black horizontal solid line