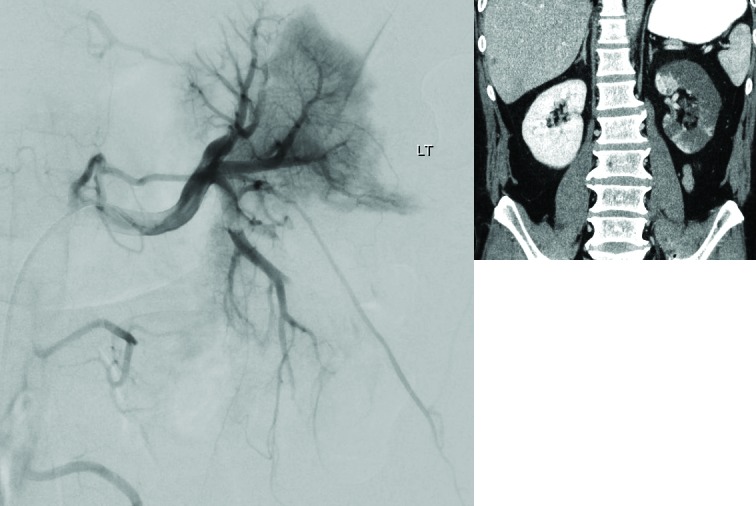
Fig. 1.

(A) Enhanced computed tomography (CT) scan showing hypoattenuation consistent with infarct throughout left kidney. (B) CT angiography showing prominent proximal thombus in the lower and upper pole second order branches and multiple distal filling defects.
