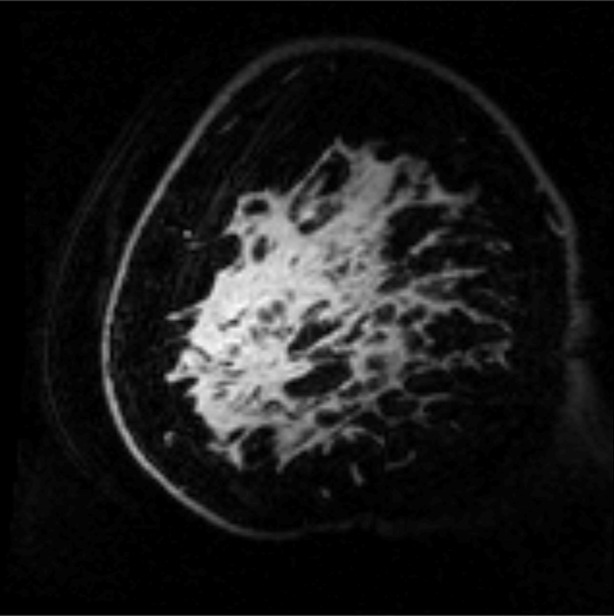
Figure 2a:

Example images from CEST MR imaging data set. (a) S0 image acquired with a saturation offset of 80 ppm provides anatomic detail. (b) APTLor map calculated by using an image acquired following saturation at 3.5 ppm downfield from water depicts an increased amide exchange affect in anterior glandular tissue. (c) GAGLor map calculated by using an image acquired 1.6 ppm downfield from water that is associated with hydroxyl protons. Color bar = percentage of signal intensity change.
