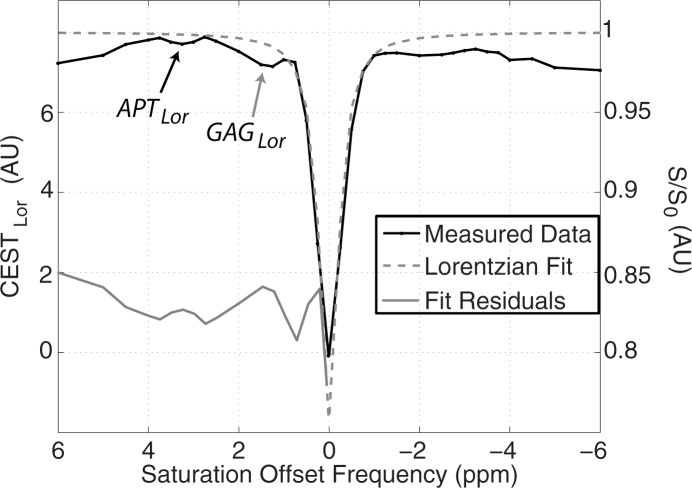
Figure 3c:
Details of CEST MR imaging data acquisition and processing. (a) Mean signal intensity of masked FG tissue in S0 image volumes (black dots) acquired intermittently used for z-spectrum normalization, where Δω = 80 ppm, plotted as a function of acquisition time. A cubic spline fit (black line) was used to extrapolate S0 signal intensities. (b) Example z-spectra normalized by the mean of the S0 signal intensities (gray line) and that normalized by the extrapolated S0 values from the spline fit (black line). (c) Example z-spectra (black line, right y-axis) with Lorentzian fit (dashed gray line, right y-axis) used to calculate the APTLor (black arrow) and GAGLor (gray arrow) from the residuals of the fit (gray line, left y-axis). AU = arbitrary units, s = seconds.

