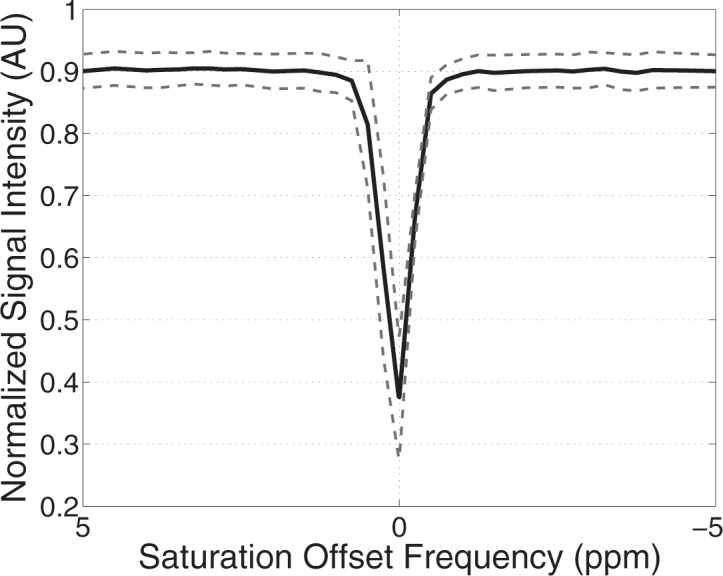
Figure 4a:

Comprehensive CEST MR imaging results. (a) Mean z-spectrum from masked FG tissue calculated for all 10 subjects is shown with the interimage standard deviation denoted by the dashed gray lines. (b, c) Imaging–repeat imaging data are shown with each subject’s examination results located adjacent to each other with the mean (solid black line) and standard deviation (dashed black lines) shown for the calculated APTLor (APTLorentzian) (b) and GAGLor (GAGLorentzian) (c) metrics. AU = arbitrary units.
