
Figure 6.
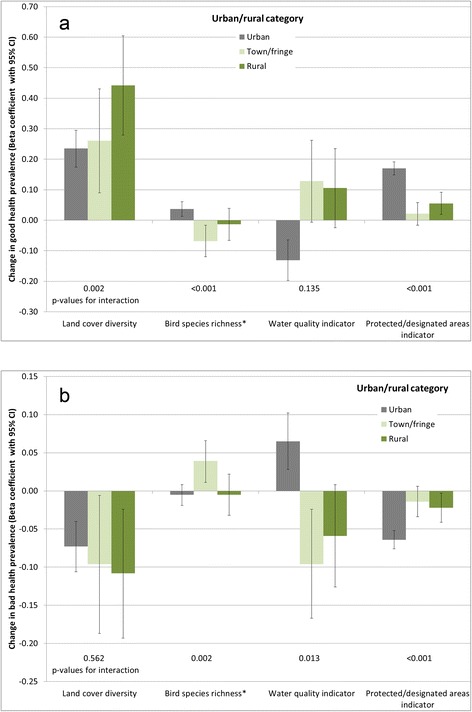
Strength of association between environmental quality indicators and a) good health prevalence, b) bad health prevalence, stratified by urban/rural category.*Coefficient associated with an increase of 10 species. p-value for interaction derives from a likelihood ratio test comparing full models with and without interaction terms between the relevant land cover type and urban/rural category in each case.