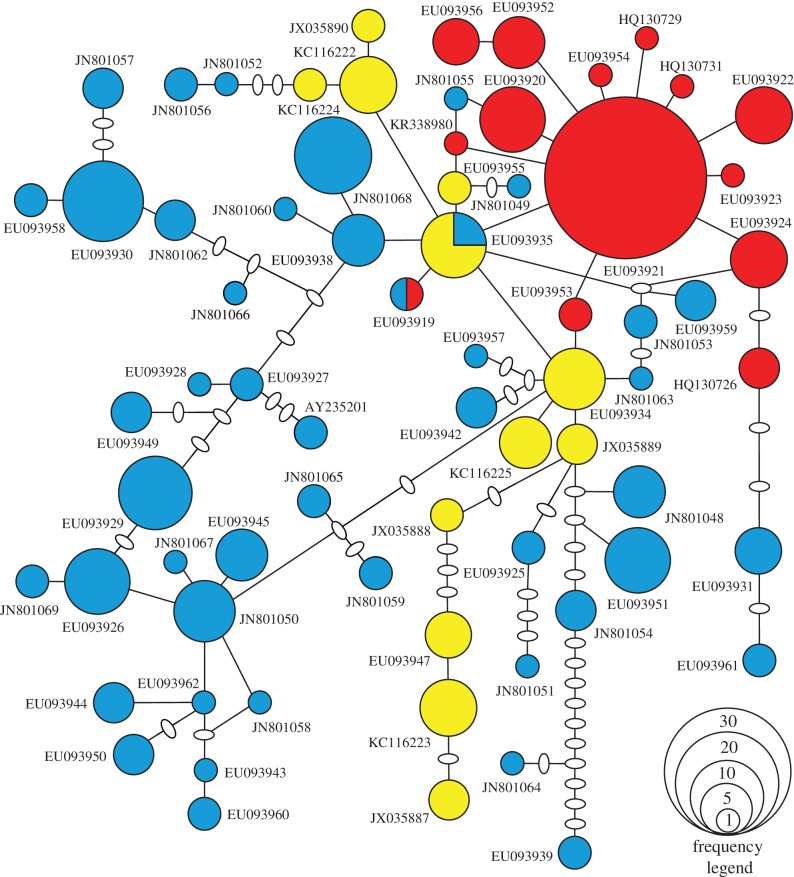
Figure 1.
Haplotype network of mtDNA control region for blue whales off Australia (red online or dark grey in print), Antarctica (blue online or medium grey in print) and Chile (yellow online or light grey in print). Each circle represents a haplotype with size corresponding to its observed frequency. Each line represents a single nucleotide difference and ovals represent unsampled or extinct haplotypes. GenBank accession numbers are shown. (Online version in colour.)

