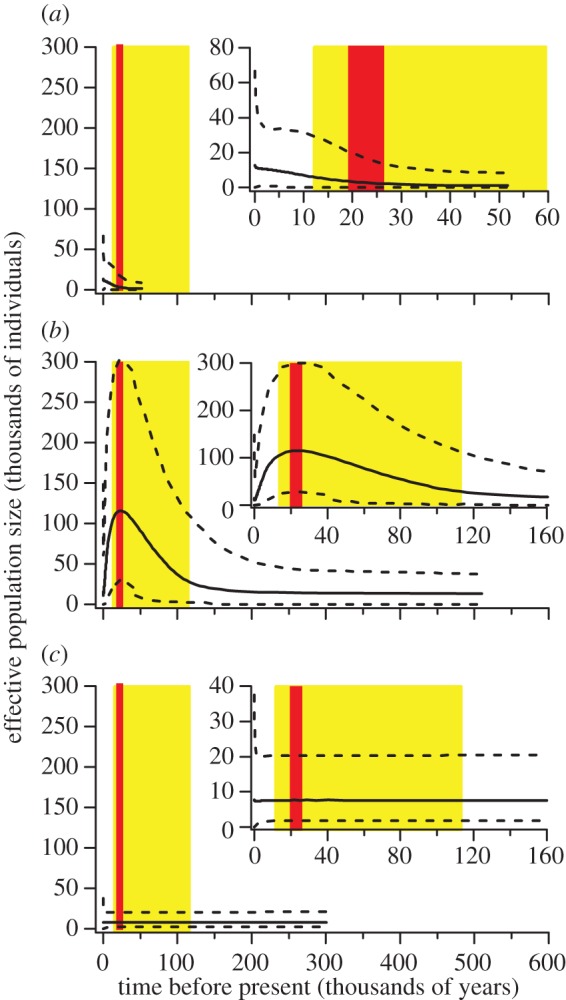
Figure 2.

Extended Bayesian skyline plots depicting changes in effective population size over time for (a) Australian pygmy blue whales, (b) Antarctic blue whales and (c) Chilean blue whales. Shown are the median (solid lines) and the 95% highest posterior density interval (dashed lines) of the analyses, and the time of the last glacial period (yellow online or light grey in print) and the LGM (red online or dark grey in print). Plot inserts are a zoomed-in part of the associated plot. (Online version in colour.)
