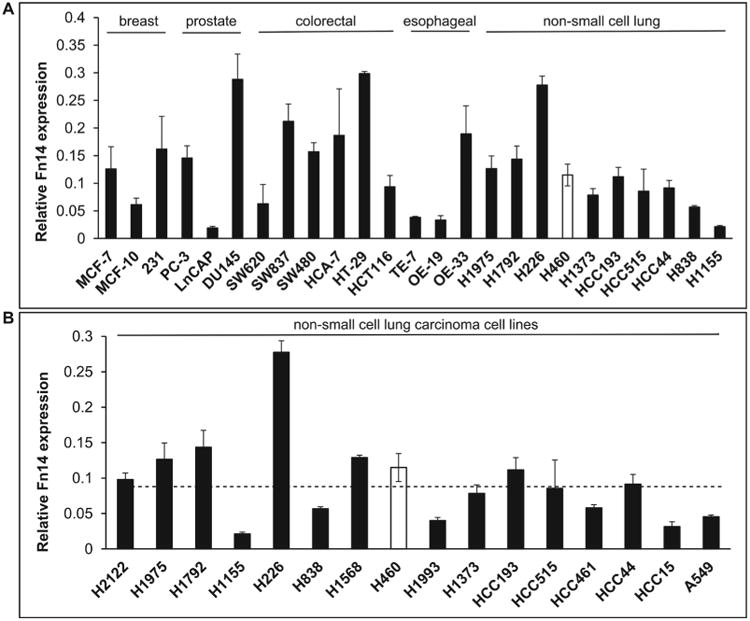
Figure 1.

mRNA expression levels of Fn14 are elevated in various tumor cell lines. A) RT-PCR analysis of mRNA expression levels of Fn14 in breast, prostate, colorectal, esophageal and lung tumor cell lines. B) RT-PCR analysis of Fn14 expression in a panel of non-small cell lung carcinoma cells. Average Fn14 mRNA expression is shown with standard error bars. Averages represent Ct values after adjustment to GAPDH and are the result of a minimum of three independent replicates.
