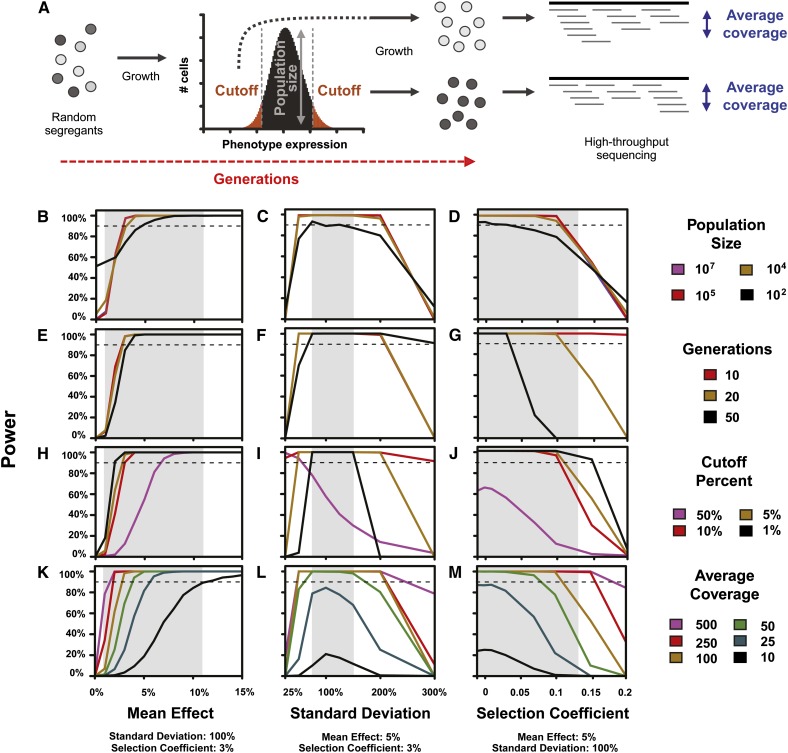
Figure 1.
Experimentally controllable parameters affect statistical power for detecting a significant difference in the frequency of a causal mutation between bulks. (A) An overview of the modeled BSA-seq experiment is shown, with the four experimental parameters we allowed to vary (population size, generations of growth, cutoff for bulk selection, and average coverage of sequencing) indicated. Power is shown for various population sizes (B−D), generations of growth (E−G), bulk selection cutoffs (H−J), and average sequencing coverages (K−M), for a range of effects of the causal mutation on mean expression (B, E, H, K), standard deviation of expression (C, F, I, L), and fitness (measured in terms of the selection coefficient) (D, G, J, M). In all plots, the dashed line indicates 90% power. Gray shaded regions represent 90% confidence intervals of the mean effect and standard deviation of the fluorescence phenotypes observed in a recent set of trans-regulatory mutants (Gruber et al. 2012, see Figure S2, A and B). The 90% confidence interval for selection coefficients was inferred from fitness assays performed on 8 mutants (see Materials and Methods and Figure S2C). In all analyses, only the indicated parameters were allowed to vary; all other experimentally controllable parameters were fixed at values ultimately used in our mapping experiment (sequencing depth = 100, population size = 107, cutoff percent = 5%, generations = 20), and mutational parameters were fixed at values representative of the mutants used for mapping (mean effect = 5%, standard deviation = 100%, selection coefficient = 0.03).

