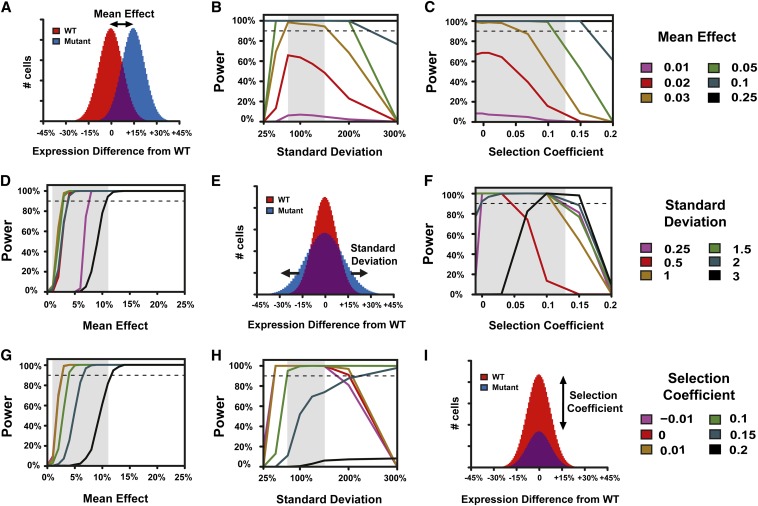
Figure 2.
Inherent properties of mutations affect statistical power to detect a difference in the frequency of a causal mutation between bulks. Power is shown for various mutation effects on mean (B, C), standard deviation (D, F), and relative fitness (G, H). Comparisons of hypothetical wild-type (red) and mutant (blue) populations with effects of a mutation on mean expression (A), standard deviation of expression (E), and relative fitness (I) are also shown. In all plots, the dashed line indicates 90% power. Gray shaded regions represent values of the mean effect, standard deviation, or selection coefficient of causal mutations observed in a recent set of expression mutants (see Figure S2). In all analyses, only the indicated parameters were allowed to vary; all others were fixed. These fixed values were: mean effect = 5%, standard deviation = 100%, selection coefficient = 0.03, sequencing depth = 100, population size = 107, cutoff percent = 5%, generations = 20.

