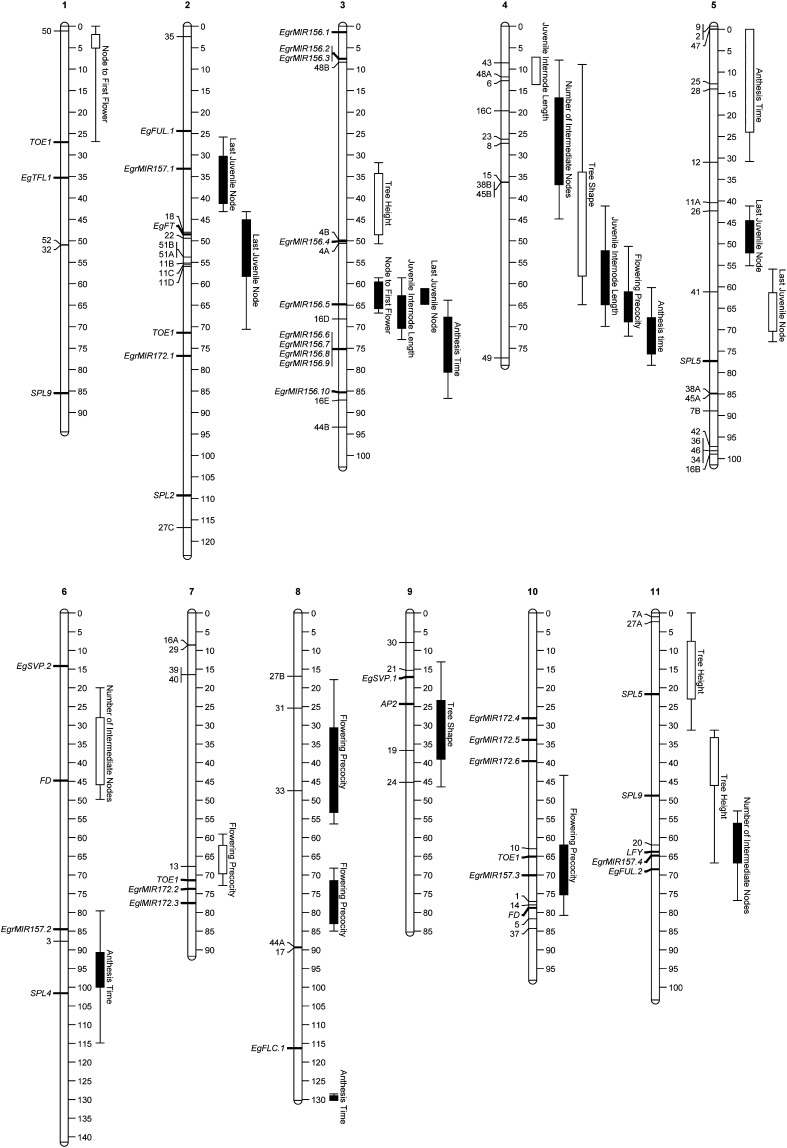
Figure 2.
The location of QTL, candidate genes, and outlier markers on the Lighthouse F2 linkage map in Eucalyptus globulus. Particularly notable is the co-location between the major QTL for last juvenile node and node to first flower on LG3 with EgrMIR156.5. Bars and lines indicate one-LOD and two-LOD QTL confidence intervals, respectively. QTL exceeding genome-wide (α ≤ 0.05) and chromosome-wide (α ≤ 0.05) significance thresholds are indicated by filled and empty bars, respectively. Significant outlier markers (Table S6) and candidate genes (Table S2) are shown on the left of linkage groups. Outlier markers are designated by a number followed by a letter (A–E) if they were present in multiple copies in the E. grandis genome sequence.

