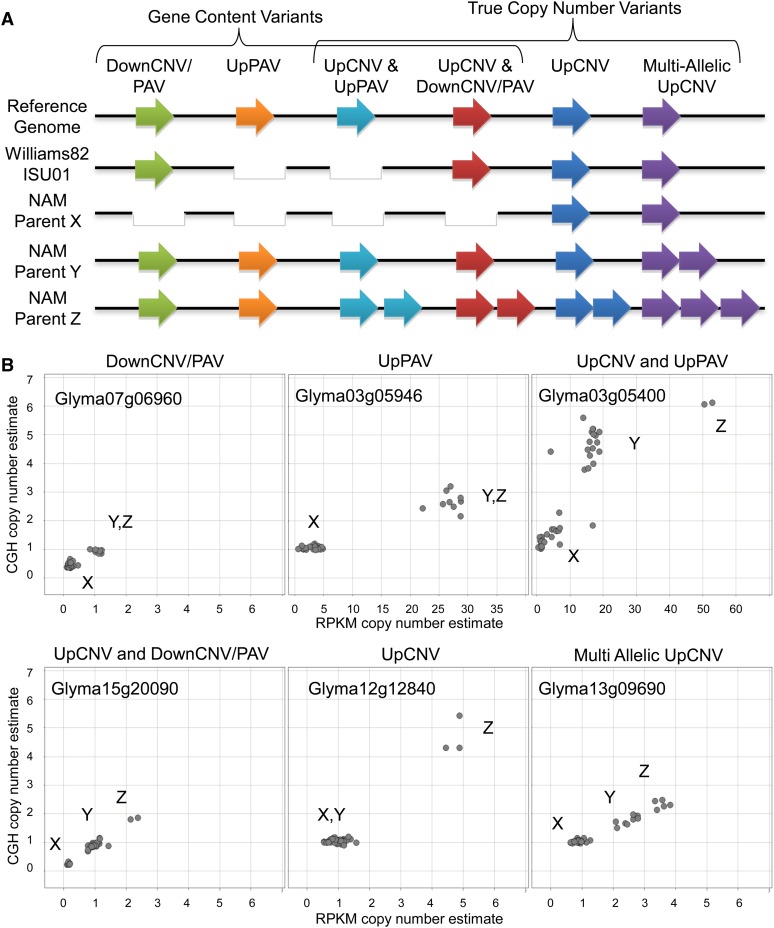
Figure 2.
Classification system for CNVs that were associated with gene models. (A) Presence–absence and copy number status for a hypothetical gene in each of the six classes. Genes are found in one of three states: single copy, absent (white gap), or multiple copies (two or more arrows). (B) Gene representatives for each of the six classes showing allelic clusters. Each gene shows one data point for each of the 41 genotypes. The estimated copy number from sequence depth and CGH are shown on the X and Y axes, respectively.

