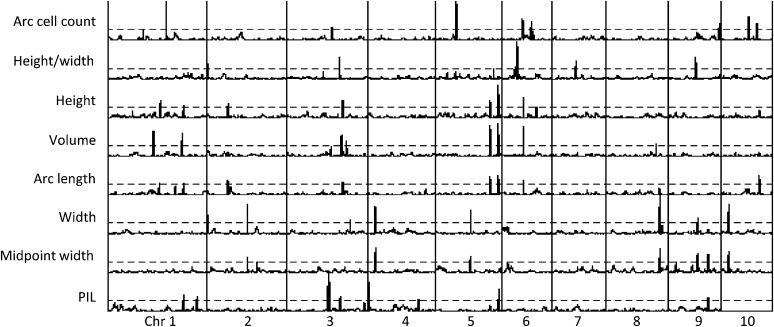
Figure 3.
Mapping results across 10 chromosomes for the eight shoot apical meristem (SAM) architecture traits. The dashed line represents the significance threshold at logarithm (base 10) of odds (LOD) = 3, and LOD axis ranged from 0 to 14.3 for each trait. Height, volume, and arc length (all highly related traits) share many quantitative trait locus (QTL), whereas width and midpoint width share a different set of QTL. Arc cell count and plastochron timing have some QTL in common with other traits, but many are unique loci.

