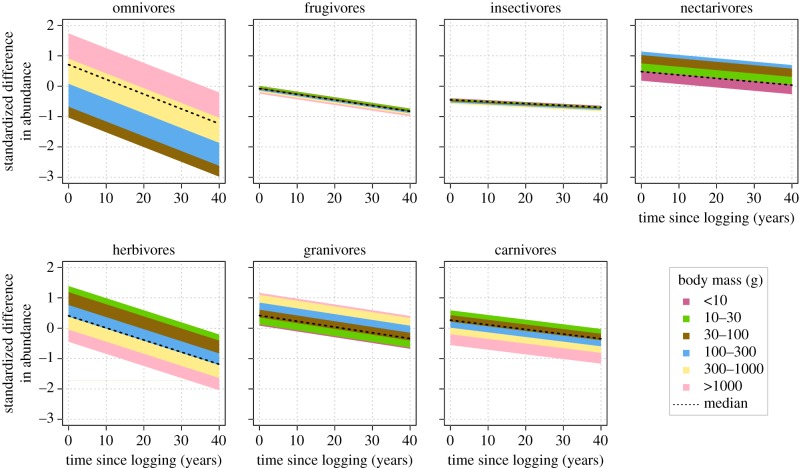
Figure 1.
The effect of time since logging on the abundance of bird species in different feeding groups and body mass categories in selectively logged tropical forests. Values are shown for species that require trees for nesting, have narrow diet breadth, are not hunted, in a forest in Asia, which has been conventionally logged one time. The width of the bands, which represent the body mass categories, corresponds to the effect size of body mass in each feeding group (table 2). Namely, wider bands signify that there are bigger differences between the response of small and large species within the feeding group. Responses are shown only for realistic body mass values within each feeding group, corresponding to the minimum, maximum and median mass for each group in our database. This results, for example, in the absence of the two largest body weight categories in the nectarivores panel, as there were no nectarivores heavier than 165 g in our database. (Online version in colour.)

