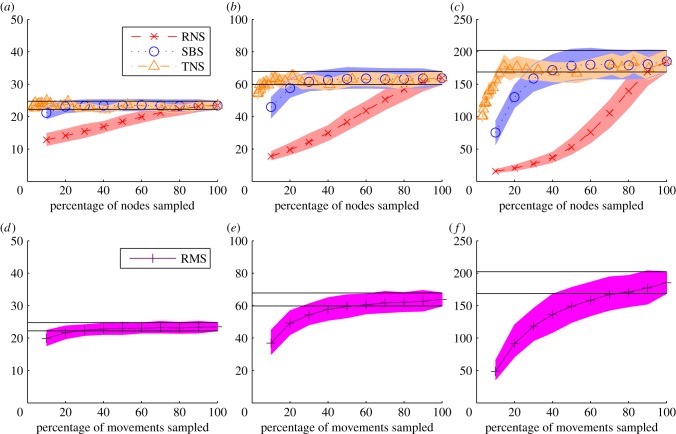
Figure 2.
(a–c) Epidemic size for outbreaks seeded in Cumbria on networks generated by RNS (crosses), SBS (circles) and TNS (triangles) as a function of nodes sampled with shaded 95% CIs for (a) 6 weeks, (b) 12 weeks and (c) the full epidemic. The solid black lines represent the 95% CIs on the average simulation for the original network. (d–f) The same results for the RMS method for (d) 6 weeks, (e) 12 weeks and (f) the full epidemic.

