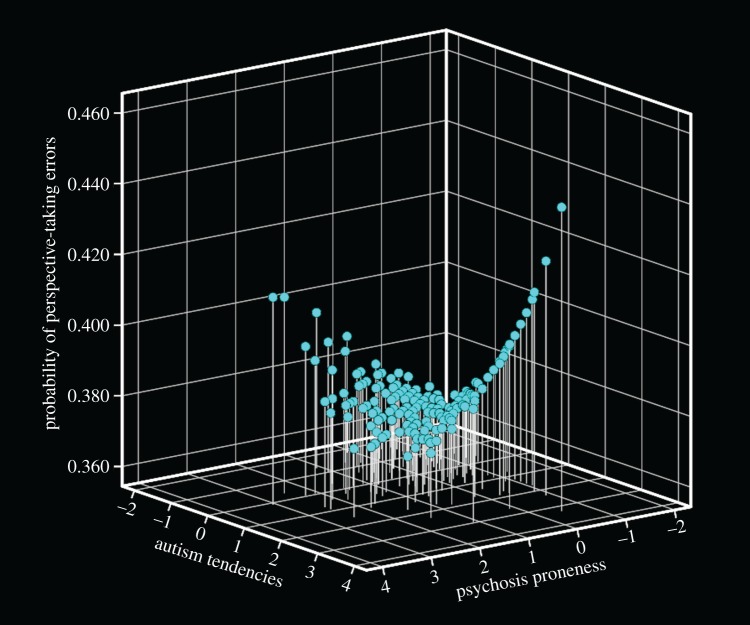
Figure 3.
Three-dimensional representation of the relationship between autism tendencies and psychosis proneness (represented as standardized Z-scores) and the probability of making PT errors on the relational trials. The negative scores represent low tendencies and the positive scores represent high tendencies. (Online version in colour.)

