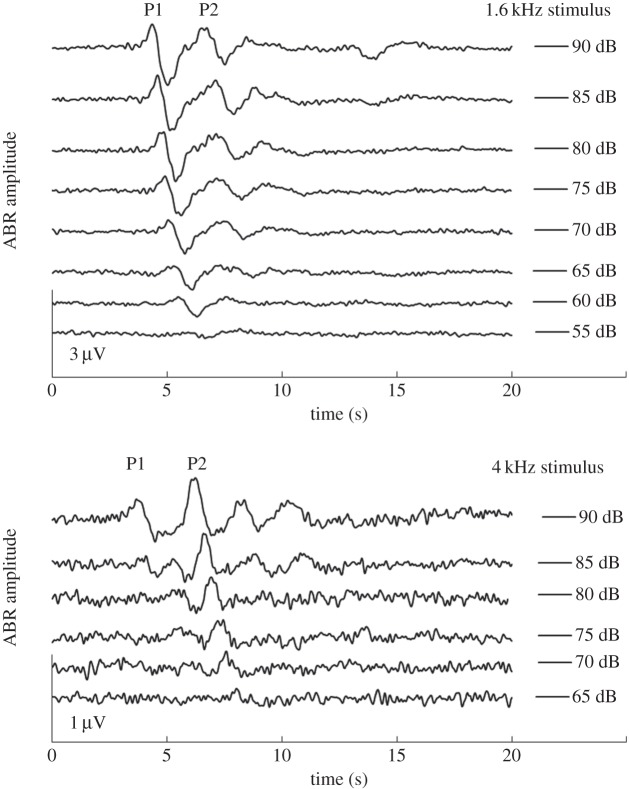
Figure 2.
Example traces of AEPs to a low-frequency (1.6 kHz) and high-frequency (4 kHz) stimulus at several stimulus intensities. The amplitude of P1 was measured from the vertex of the first positive peak (marked P1) to the subsequent negative trough. P2 amplitude was measured from the vertex of the second positive peak to the subsequent negative trough.

