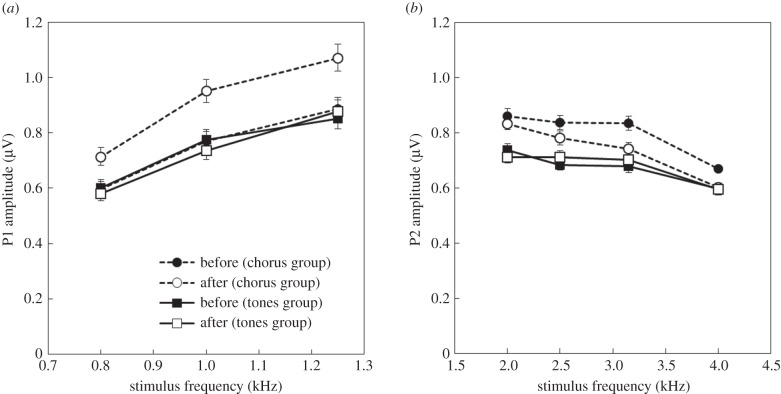
Figure 4.
(a) Amplitude (±s.e.) of peak one (P1) of the AEP as a function of stimulus, time, and frequency. The AEP amplitudes are average across intensity. (b) Amplitude (±s.e.) of peak two (P2) of the AEP as a function of stimulus, time and frequency. The difference in P2 amplitude between the two groups before exposure is probably due to the relative numbers of males and females in each group, as females had a higher average P2 amplitude.

