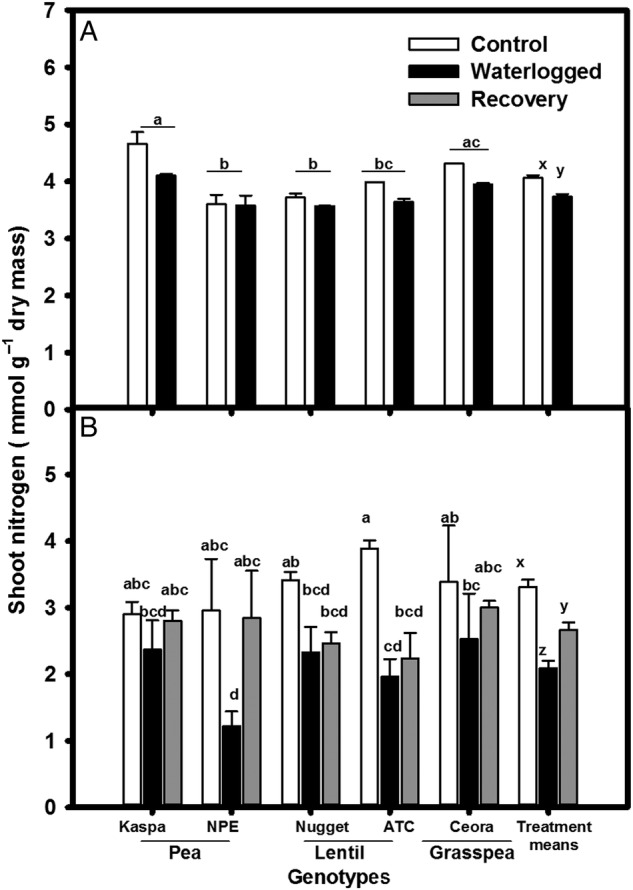
Figure 4.

Effect of waterlogging treatment on shoot nitrogen (mmol g−1 dry mass) of legume genotypes (A) after 14 days and (B) after 35 days of growth. Treatments were drained control (white bars), continuously waterlogged (black bars), 14 days waterlogged and subsequent 21 days of recovery (grey bars). Values are the means of four replicates standard errors. Overall treatment (+SE) means are shown grouped on the right. Means associated with different letters are significantly different (P < 0.05) by Tukey's test.
