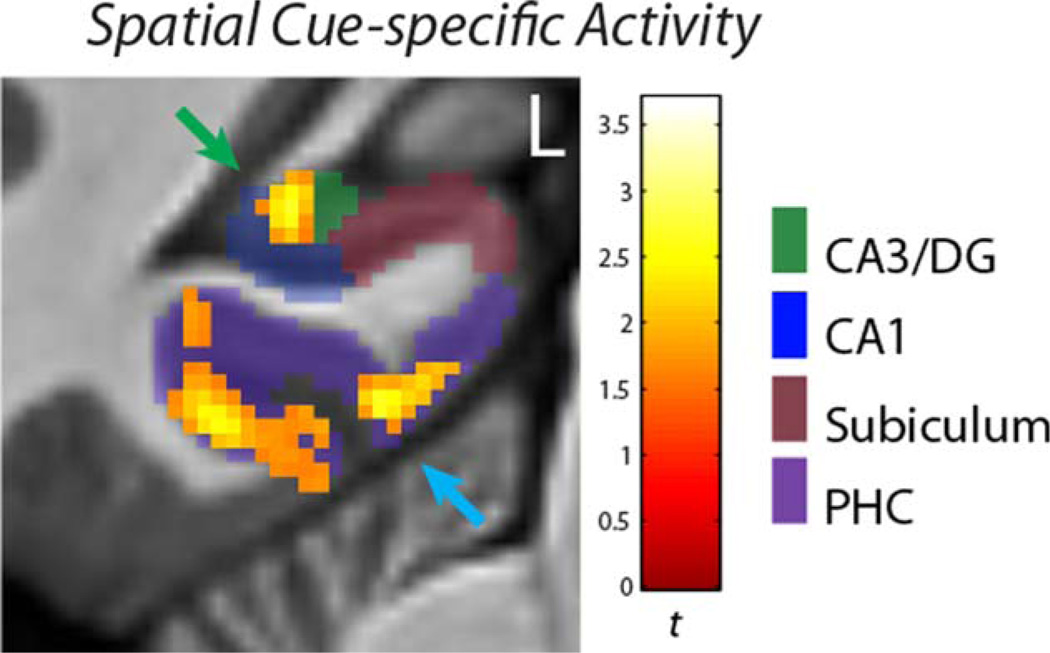
FIGURE 3.
Cue-specific activity. This figure shows OLNew activity in the CA3/DG subfield (green arrow) and parahippocampal cortex (blue arrow) that is greater for the initial Cue period than subsequent navigation of the first hallway of the mazes. These clusters also had Cue-specific activity for the OLOld mazes. The activity was thresholded at P < 0.005(corr P < 0.05). [Color figure can be viewed in the online issue, which is available at wileyonlinelibrary.com.]

