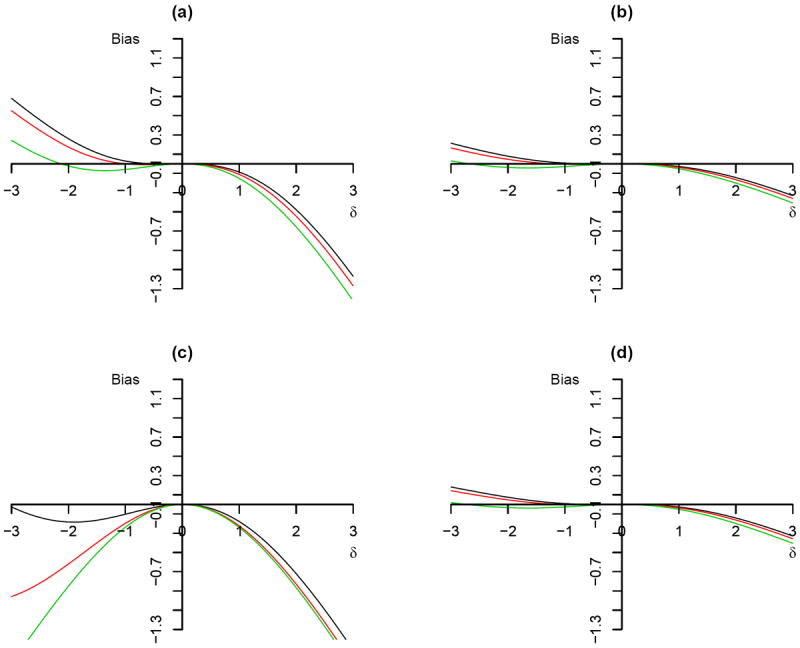
Figure 2.

Plot of bias against magnitude of unmeasured confounding Δ using 2SRI method: (a) P (R = 1) = 0.8, ρa = 0, ρc = 0.5, , . (b) P (R = 1) = 0.8, ρa = 0, ρc = 0.8, , .(c) P (R = 1) = 0.8, ρa = 0, ρc = 0.5, , . (d) P (R = 1) = 0.5, ρa = 0, ρc = 0.8, , . The different colour of solid line corresponds to different shape parameter: black (α = 0.5), red (α = 1), and green (α = 2).
