
Figure 4.
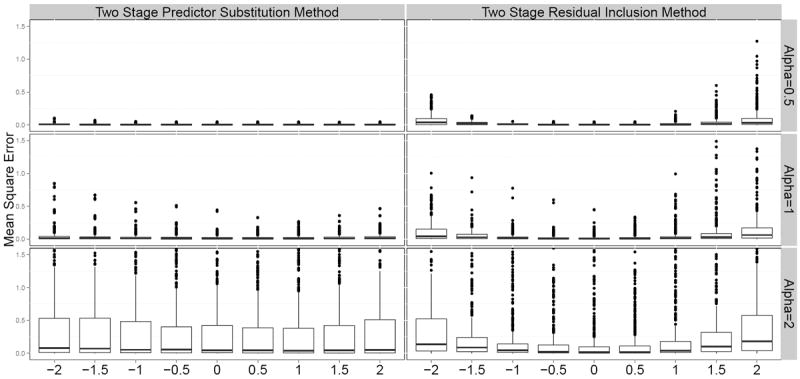
Mean square error in estimating log causal hazard ratio using two stage IV methods (X-axis is the magnitude of confounding Δ, Y-axis is the Mean Square Error). For 2SRI method or 2SPS method, the mean square error computed for each of 1458 possible scenarios were grouped by the magnitude of shape parameter α (decreasing hazard for α = 0.5, constant hazard for α = 1, and increasing hazard for α = 2) and the magnitude of confounding Δ (larger values represent lager confounding effects and 0 represents no confounding).