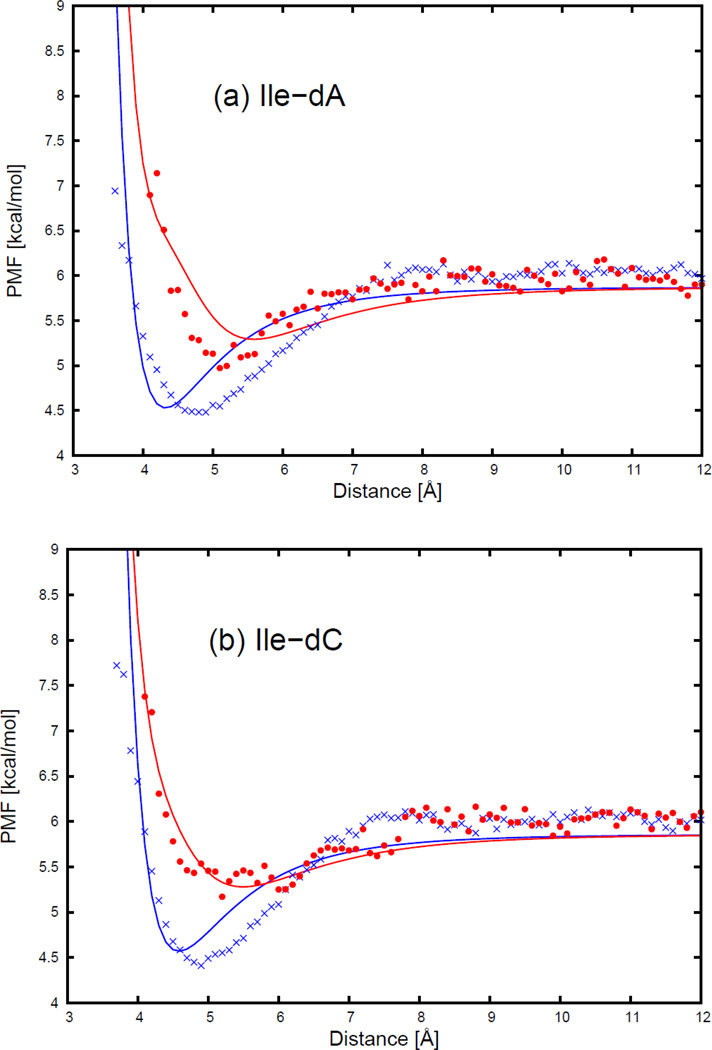
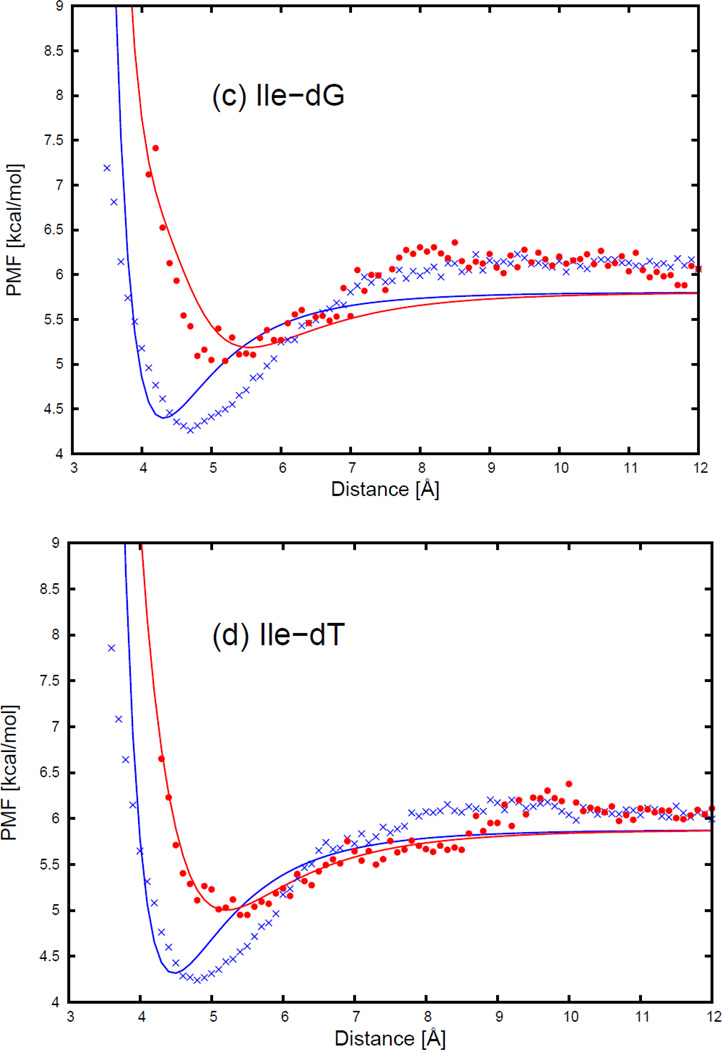
Figure 5.
The PMF curves for (a) isoleucine side chain-adenine base, (b) isoleucine side chain-cytosine base, (c) isoleucine side chain-guanine base, and (d) isoleucine side chain-thymine base. The blue cross and red circle symbols correspond to PMFs determined from the MD simulations for the side-to-side (Figure 11.a) and the edge-to-head (Figure 11.b) orientations, respectively. The blue and red solid lines correspond to the analytical approximation (Eq. 6) to the PMFs for the side-to-side and the edge-to-head orientations, with parameters determined by least-squares fitting of the analytical expression to the PMF determined by the MD simulations.


