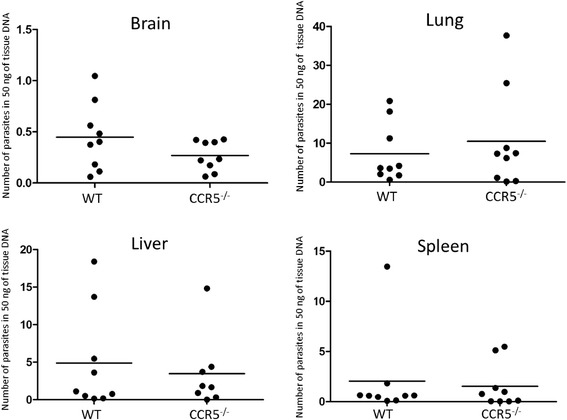
Figure 2.

Parasite burden in tissues. The values are the number of parasites in 50 ng of tissue DNA. The number of parasites per individual (symbols) and mean levels (horizontal lines) are indicated (N = 9). Data were obtained from two independent experiments performed together. No significant difference was observed between the two groups by a student’s t-test.
