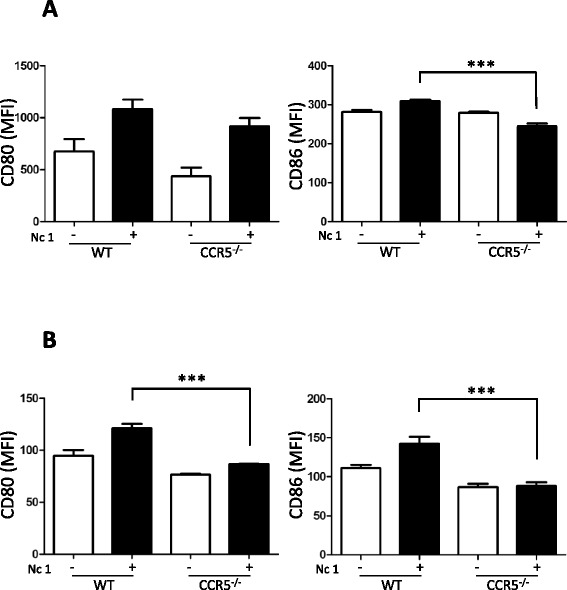
Figure 4.

Expression of cell surface markers on peritoneal macrophages and BMDCs. The peritoneal macrophages (A) and BMDCs (B) were obtained from CCR5−/− mice and C57BL/6 mice (wild-type, WT). Each value represents the mean fluorescence intensity (MFI) of the marker ± the standard deviation of three replicate samples. “–” indicates no stimuli and “+” indicates infection with N. caninum tachyzoites (Nc1). Data were analyzed by one-way ANOVA tests followed by Tukey’s multiple comparison. ***P < 0.001. Reproducibility of the data was confirmed by three independent experiments.
