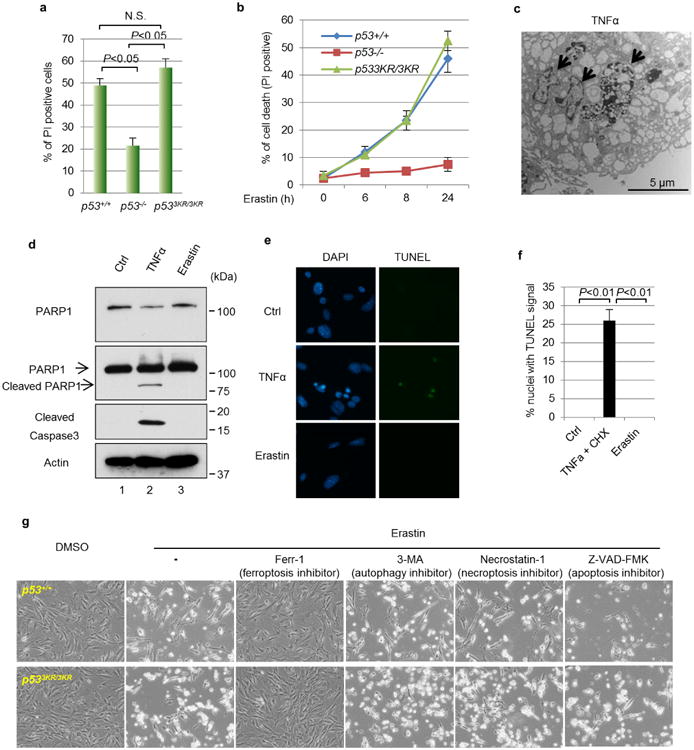
Extended Data Figure 2. Characterization of erastin-induced cell death in MEFs.

a, Quantification of cell death as shown in Fig. 3a. Error bars are s.d. from two technical replicates. b, Kinetics of cell death induced by erastin (1 μM) over a 24-h period in MEFs with indicated genotypes. Technical replicates were performed and mean ± s.d. are shown (n = 2). c, Transmission electron microscopy image of wild-type MEFs that were treated with TNFα (20 ng ml−1) and CHX (5 μg ml−1) for 16 h with arrows pointing to fragmented nuclei. d, Wild-type MEFs were treated with mouse TNFα (20 ng ml−1) and CHX (5 μg ml−1) or erastin (1 μM) for 8 h followed by western blots.e, TUNEL assay was carried out using wild-type MEFs treated as in d. f, Quantification of TUNEL signals for e. Mean ± s.d. from ten random microscope views are shown (magnification, ×20). g, MEFs with indicated p53 status were treated with erastin (4 μM) and specific cell death inhibitors for 8 h before images were taken (magnification, ×10). 3-MA, 3-methylademine. All experiments were repeated at least three times and representative data are shown.
