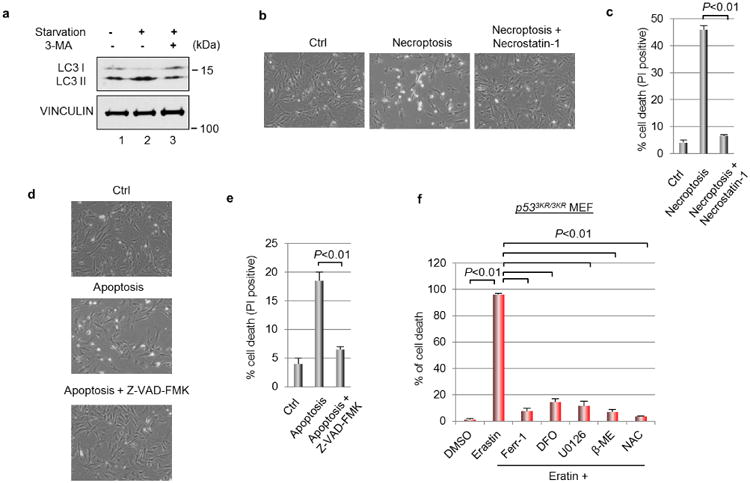
Extended Data Figure 3. Effectiveness of cell death inhibitors.

a, Wild-type MEF cells were starved in DMEM medium deprived of glucose, sodium pyruvate or l-glutamine for 2 h with or without 3-methylademine (2 mM) followed by western blots. b, Wild-type MEFs were treated for 48 h with TNFα (20 ng ml−1), SMAC mimetic (100 nM) and Z-VAD-FMK (10 μg ml−1) to induced necroptosis with or without the presence of necrostatin-1 (10 μg ml−1) (magnification, ×10). c, Quantification of cell death as shown in b. PI, propidium iodide. Mean ± s.d. from two technical replicates are shown. d, Wild-type MEFs were treated for 48 h with TNFα (20 ng ml−1), SMAC mimetic (100 nM) and necrostatin-1 (10 μg ml−1) to induce apoptosis with or without the presence of Z-VAD-FMK (10 μg ml−1) (magnification, ×10). e, Quantification of cell death as shown in d. Mean ± s.d. from two technical replicates are shown. f, p533KR/3KR MEFs were treated with erastin (4 μM) and various chemicals that block ferroptosis for 24 h before the percentage of cell death was determined; error bars, s.d. from two technical replicates. DMSO, dimethyl sulfoxide; DFO, deferoxamine; U0126, 1,4-diamino-2,3-dicyano-1,4-bis[2-aminophenylthio] butadiene; β-ME, β-mercaptoethanol; NAC, N-acetyl-l-cysteine. All experiments were independently repeated three times.
