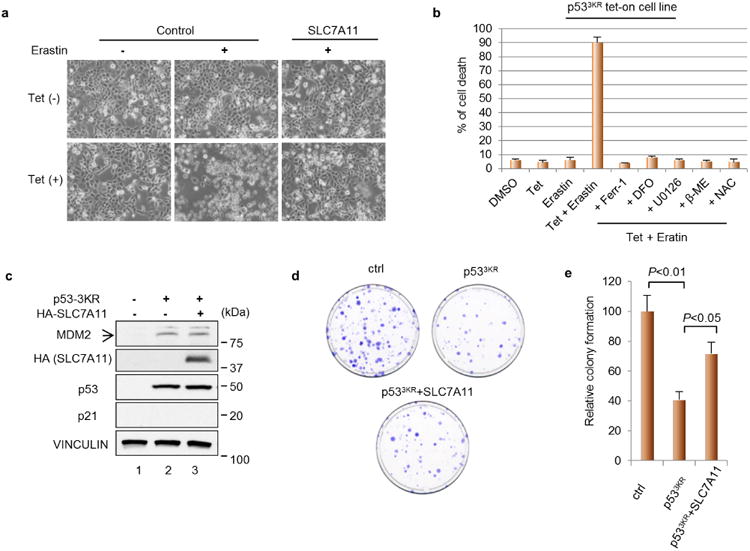
Extended Data Figure 5. Cell death induced by p533KR and erastin is ferroptosis and effect of SLC7A11 overexpression on colony formation.

a, Representative phase-contrast images of cell cultures as treated in Fig. 4b (magnification, ×10). b, p533KR tet-on stable line cells were treated as indicated and the percentage of cell death was quantified (DFO, deferoxamine; U0126, 1,4-diamino-2,3-dicyano-1,4-bis[2-aminophenylthio] butadiene; β-ME, beta-mercaptoethanol; NAC, N-acetyl-l-cysteine). Mean ± s.d. from two technical replicates are shown. c, H1299 cells were transfected with indicated plasmids followed by western blot 24 h later. HA, haemagglutinin d, Representative images of colony formation assay in 10-cm plates as transfected in c. e, Quantification of colony formation assay as shown in d. Numbers of colonies formed in control plates were normalized to 100 and mean ± s.d. from two technical replicates are shown. All experiments were repeated three times with representative data shown.
