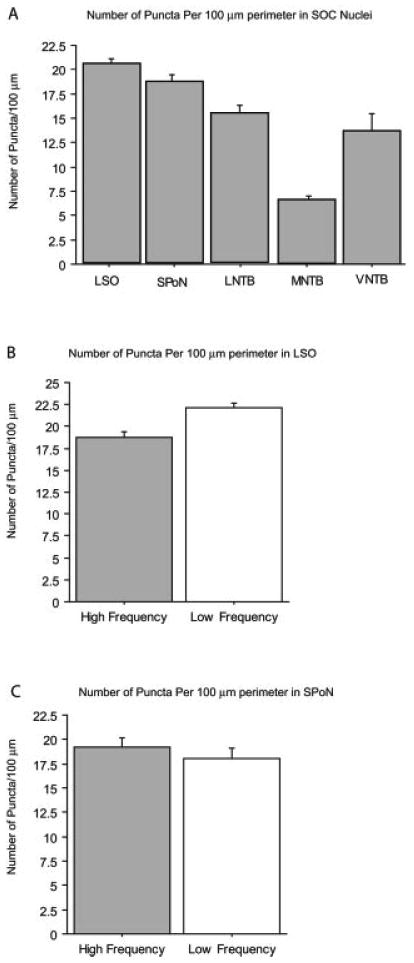
Fig. 6.

Average number of axo-somatic Gly-IR puncta per 100 μm of cell perimeter in SOC nuclei of normal hearing animals. In the five animals assessed, the LSO and SPoN were divided into high- and low-frequency regions. Of the neurons examined in each of the five nuclei the LSO (n = 255 high-frequency compared to 223 low-frequency neurons) and SPoN (n = 125 high-frequency compared to 93 low-frequency neurons) had the largest average number of glycine immunoreactive puncta, followed by neurons in the LNTB (n = 198 neurons), MNTB (n = 315), and VNTB (n = 143 neurons). Error bars are SEM.
