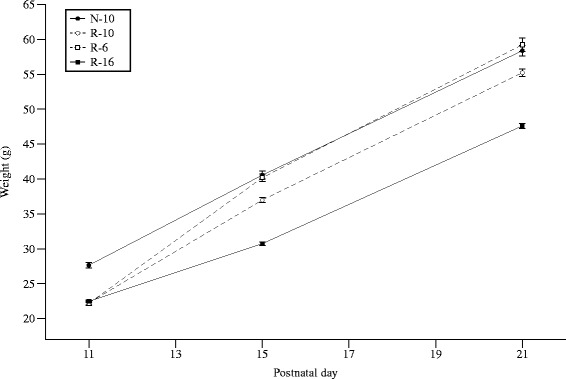
Fig. 3.

Postnatal weight (g) from d11-21. All R groups diverged by d12. By d15, the N-10 and R-6 groups were similar, the R-16 group showed no catch-up growth, and the R-10 group caught-up half-way between the N-10 and R-16 groups. Error bars represent ± 1 SEM, if not visible they are smaller than the plot symbol
