Fig. 6.

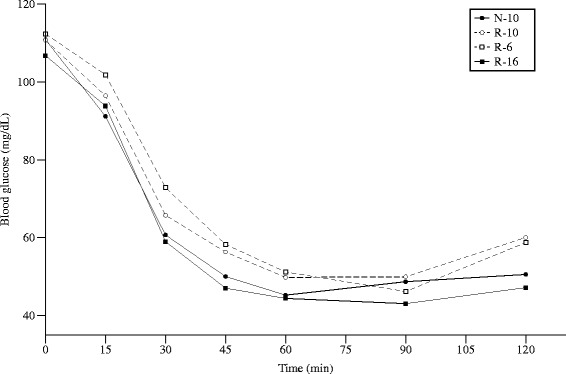
Blood glucose during an intraperitoneal insulin tolerance test (ITT) at d50. Fasting blood glucose was similar in all four groups. Error bars represent ± 1 SEM, if not visible they are smaller than the plot symbol

Blood glucose during an intraperitoneal insulin tolerance test (ITT) at d50. Fasting blood glucose was similar in all four groups. Error bars represent ± 1 SEM, if not visible they are smaller than the plot symbol