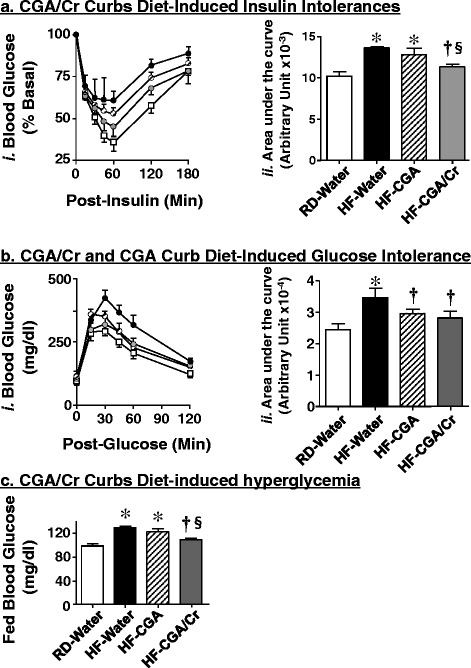
Fig. 3.

CGA/Chromium III Supplement Curbs Diet-induced Metabolic Abnormalities. Mice were fed for 4 weeks with RD (squares) or HF (circles) before receiving an oral gavage of water (black circles), CGA alone (hatched circles) and CGA/Chromium III (CGA/Cr) (gray circles), once daily as they continued to be fed the same diet for additional 3 weeks, as in the legend to Fig. 2. At the end of treatment, mice (n = 7-8 per each treatment per feeding group) were subjected to: a an intra-peritoneal insulin tolerance test to assess glucose disposal at 0–180 min post-insulin injection, b an intra-peritoneal glucose tolerance test to examine glucose disposal at 0–120 min post glucose injection, and (c) fed blood glucose levels. For (a-b), the area under the curve (AUC) was measured from each graph and presented in the bar graphs (panels ii) to the right of each graph in (a) and (b). Values are expressed as mean ± SEM. *P <0.05 versus RD-water (white bars), †versus HF-water (black bars), and § versus HF-CGA (hatched bars)
