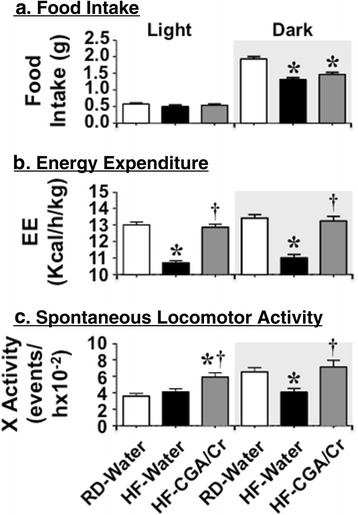
Fig. 4.

Indirect Calorimetry Analysis. At the end of the treatment period, mice were individually placed in calorimetric cages (n = 4/treatment group) with free access to food and water for 2 days to acclimate followed by indirect calorimetry analysis in a 24 h-period for 3 days to measure: a Food Intake (food g/mouse/ day), b Energy Expenditure (kcal/h/kg BW), and c Spontaneous locomotor activity (events/h) in each of the light (from 600 to 1800 h) and dark (from 1800 to 600 h-Gray shaded) cycle. Values are expressed as mean ± SEM of each time interval in the last 3 days. * P <0.05 versus RD-water (white bars) and †versus HF-water (black bars)
