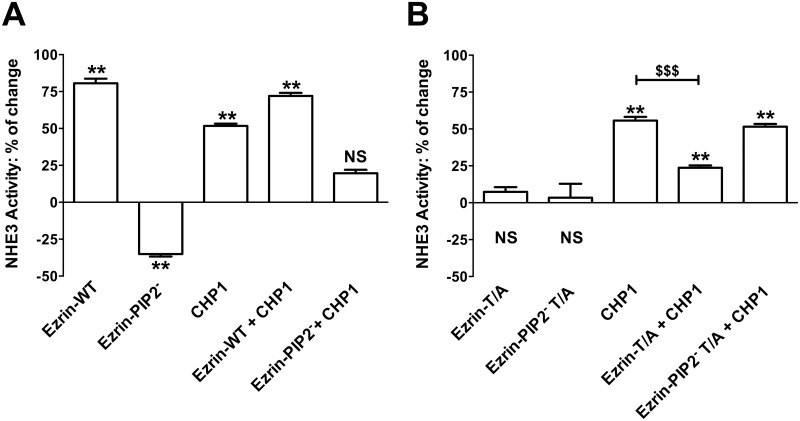
Fig 4. Effect of CHP1 expression on the ezrin-mediated control of NHE3 activity.
NHE3 activity was measured as described in the legend of Fig 3. Bars and error bars represent the means and SE, respectively (8 experiments per condition). **P < 0.01 ANOVA compare to control (empty-vector-transfected cells), NS: Statistically insignificant compare to control. $$$P<0.001 ANOVA, CHP1 expression compared to CHP1 and Ezrin-T/A co-expression. Effect of expression of A. Ezrin-WT, Ezrin-PIP2-, CHP1, CHP1 + Ezrin-WT or CHP1 + Ezrin-PIP2-. B. Ezrin-T/A, Ezrin-PIP2- T/A, CHP1, CHP1 + Ezrin-T/A or CHP1 + Ezrin-PIP2- T/A on NHE3 activity.

