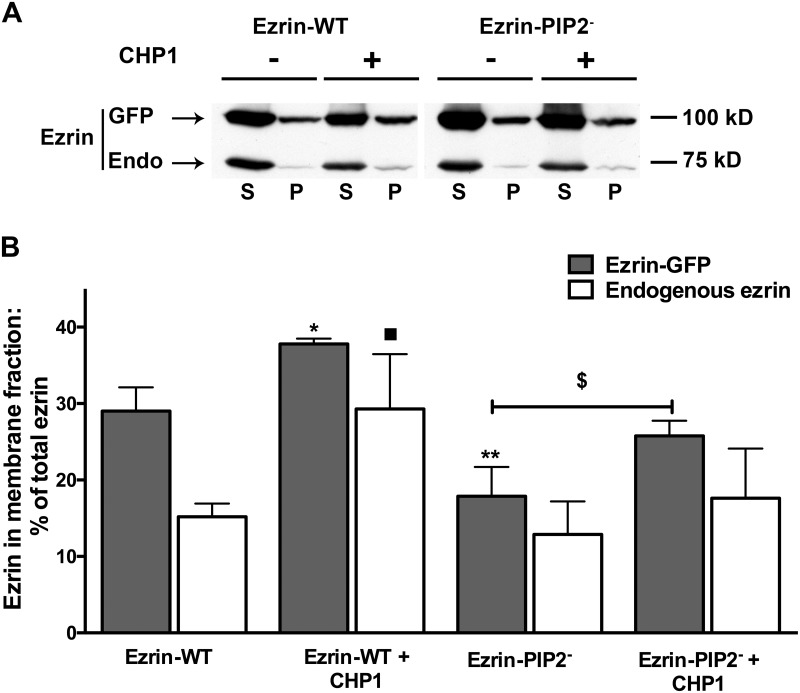
Fig 5. Effect of CHP1 expression on Ezrin-WT or Ezrin-PIP2-distribution in sub-cellular fraction.
Cellular fractions were prepared as described in the legend of Fig 2. A: One of the immunoblots is shown. GFP = transfected mEGFP tagged ezrin (Ezrin-GFP) and Endo = endogenous ezrin. B: Statistical analysis of signal intensity ratios relative to the immuno-detected band in S and P is reported. The signal of total ezrin in S plus P fractions was defined as equal to 100% for each condition and results are expressed as percentage of total ezrin in the P vs. S fraction. Antigen signals were normalized to β-actin. Bars and error bars represent the means ± SE, respectively (4 experiments per condition). *P<0.05/**P < 0.01 ANOVA, membrane fraction of tagged ezrin in the presented groups compared to the membrane fraction of tagged ezrin in cells transfected with Ezrin-WT. ■P<0.05 ANOVA, membrane fraction of endogenous ezrin in the presented groups compared to the membrane fraction of endogenous ezrin in cells transfected with Ezrin-WT. $P<0.05 ANOVA, membrane fraction of tagged ezrin in Ezrin-PIP2- compared to Ezrin-PIP2- + CHP1 transfected cells.

